

A poke in the eye: inhibiting HIV-1 protease through its flap-recognition pocket
- PMID: 18381626
- PMCID: PMC2859825
- DOI: 10.1002/bip.20993
A poke in the eye: inhibiting HIV-1 protease through its flap-recognition pocket
Abstract
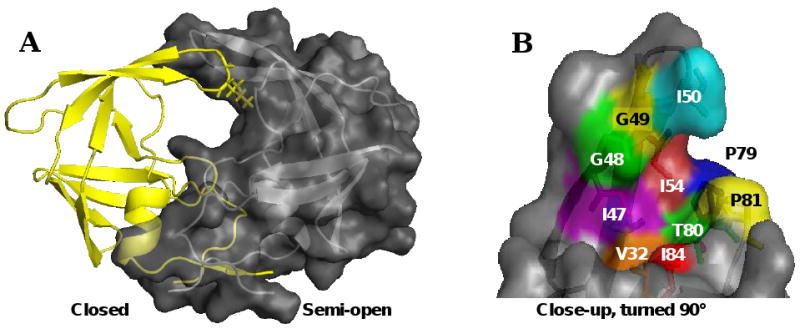
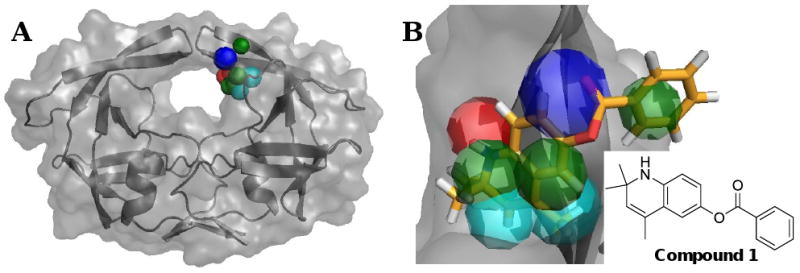
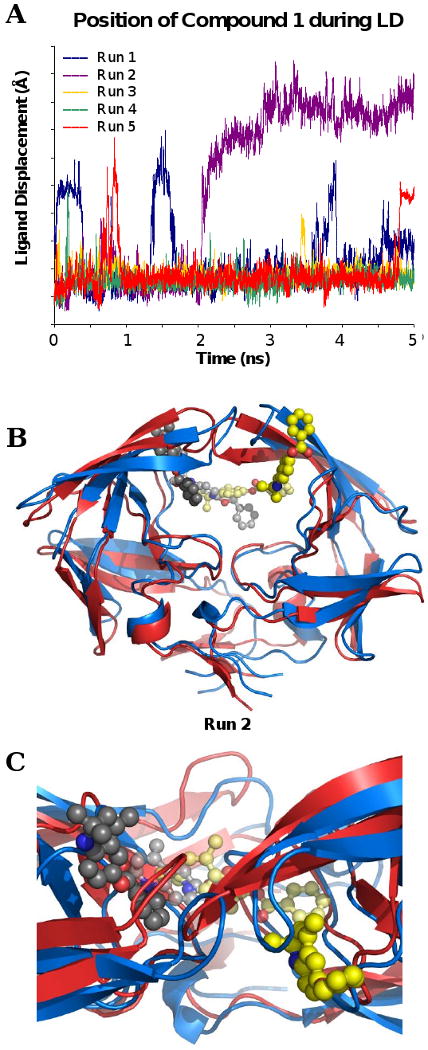
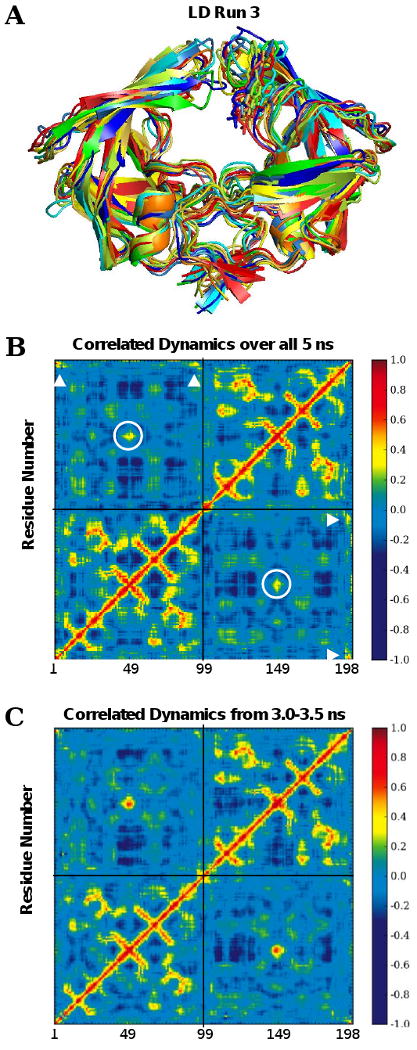
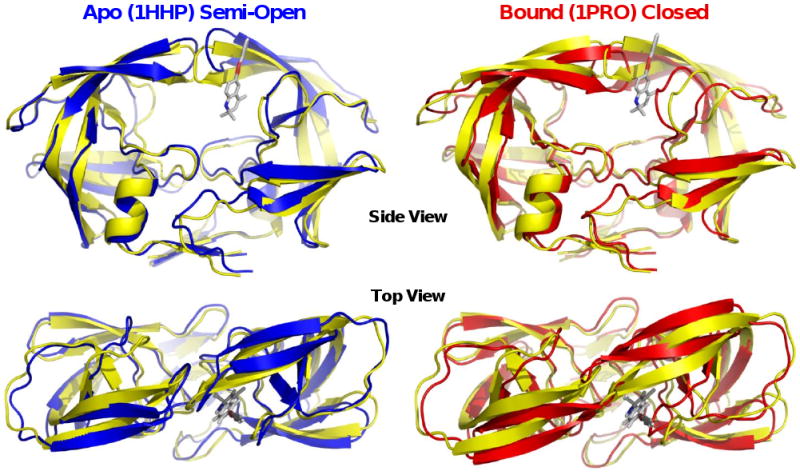
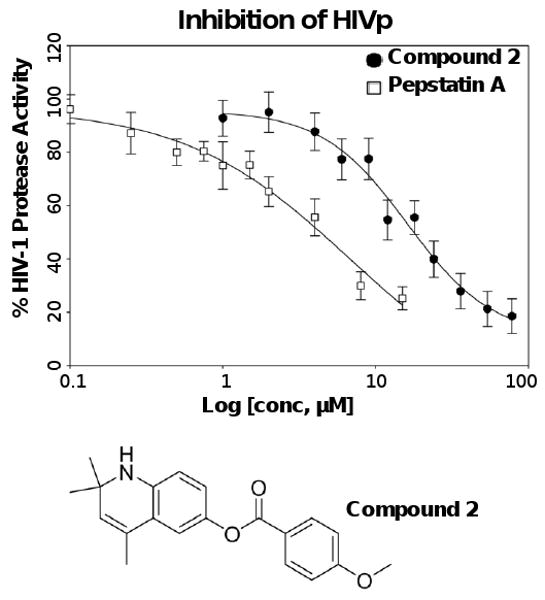
A novel mechanism of inhibiting HIV-1 protease (HIVp) is presented. Using computational solvent mapping to identify complementary interactions and the Multiple Protein Structure method to incorporate protein flexibility, we generated a receptor-based pharmacophore model of the flexible flap region of the semiopen, apo state of HIVp. Complementary interactions were consistently observed at the base of the flap, only within a cleft with a specific structural role. In the closed, bound state of HIVp, each flap tip docks against the opposite monomer, occupying this cleft. This flap-recognition site is filled by the protein and cannot be identified using traditional approaches based on bound, closed structures. Virtual screening and dynamics simulations show how small molecules can be identified to complement this cleft. Subsequent experimental testing confirms inhibitory activity of this new class of inhibitor. This may be the first new inhibitor class for HIVp since dimerization inhibitors were introduced 17 years ago.
2008 Wiley Periodicals, Inc
Figures
Similar articles
-
Structural analysis of lead fullerene-based inhibitor bound to human immunodeficiency virus type 1 protease in solution from molecular dynamics simulations.J Mol Graph Model. 2007 Sep;26(2):558-70. doi: 10.1016/j.jmgm.2007.03.013. Epub 2007 Apr 4. J Mol Graph Model. 2007. PMID: 17468026
-
Flap opening in HIV-1 protease simulated by 'activated' molecular dynamics.Nat Struct Biol. 1995 Apr;2(4):334-8. doi: 10.1038/nsb0495-334. Nat Struct Biol. 1995. PMID: 7796268
-
HIV-1 protease flaps spontaneously close to the correct structure in simulations following manual placement of an inhibitor into the open state.J Am Chem Soc. 2006 Mar 8;128(9):2812-3. doi: 10.1021/ja058211x. J Am Chem Soc. 2006. PMID: 16506755 Free PMC article.
-
Novel strategies for targeting the dimerization interface of HIV protease with cross-linked interfacial peptides.Biopolymers. 2002;66(2):126-33. doi: 10.1002/bip.10232. Biopolymers. 2002. PMID: 12325162 Review.
-
Inhibitors of HIV-1 protease: a major success of structure-assisted drug design.Annu Rev Biophys Biomol Struct. 1998;27:249-84. doi: 10.1146/annurev.biophys.27.1.249. Annu Rev Biophys Biomol Struct. 1998. PMID: 9646869 Review.
Cited by
-
Parameter choice matters: validating probe parameters for use in mixed-solvent simulations.J Chem Inf Model. 2014 Aug 25;54(8):2190-9. doi: 10.1021/ci400741u. Epub 2014 Aug 1. J Chem Inf Model. 2014. PMID: 25058662 Free PMC article.
-
Elasticity-Associated Functionality and Inhibition of the HIV Protease.Adv Exp Med Biol. 2022;1371:79-108. doi: 10.1007/5584_2021_655. Adv Exp Med Biol. 2022. PMID: 34351572
-
Text mining improves prediction of protein functional sites.PLoS One. 2012;7(2):e32171. doi: 10.1371/journal.pone.0032171. Epub 2012 Feb 29. PLoS One. 2012. PMID: 22393388 Free PMC article.
-
Protein flexibility in docking and surface mapping.Q Rev Biophys. 2012 Aug;45(3):301-43. doi: 10.1017/S0033583512000066. Epub 2012 May 9. Q Rev Biophys. 2012. PMID: 22569329 Free PMC article. Review.
-
Fragment-based screen against HIV protease.Chem Biol Drug Des. 2010 Mar;75(3):257-68. doi: 10.1111/j.1747-0285.2009.00943.x. Epub 2010 Jan 19. Chem Biol Drug Des. 2010. PMID: 20659109 Free PMC article.
References
Publication types
MeSH terms
Substances
Grants and funding
LinkOut - more resources
Full Text Sources
