Effect of destrin mutations on the gene expression profile in vivo
- PMID: 18381839
- PMCID: PMC2435404
- DOI: 10.1152/physiolgenomics.00285.2007
Effect of destrin mutations on the gene expression profile in vivo
Abstract
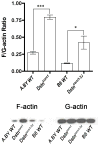
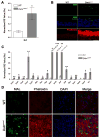
Remodeling of the actin cytoskeleton through actin dynamics (assembly and disassembly of filamentous actin) is known to be essential for numerous basic biological processes. In addition, recent studies have provided evidence that actin dynamics participate in the control of gene expression. A spontaneous mouse mutant, corneal disease 1 (corn1), is deficient for a regulator of actin dynamics, destrin (DSTN, also known as ADF), which causes epithelial hyperproliferation and neovascularization in the cornea. Dstn(corn1) mice exhibit an actin dynamics defect in the corneal epithelial cells, offering an in vivo model to investigate cellular mechanisms affected by the Dstn mutation and resultant actin dynamics abnormalities. To examine the effect of the Dstn(corn1) mutation on the gene expression profile, we performed a microarray analysis using the cornea from Dstn(corn1) and wild-type mice. A dramatic alteration of the gene expression profile was observed in the Dstn(corn1) cornea, with 1,226 annotated genes differentially expressed. Functional annotation of these genes revealed that the most significantly enriched functional categories are associated with actin and/or cytoskeleton. Among genes that belong to these categories, a considerable number of serum response factor target genes were found, indicating the possible existence of an actin-SRF pathway of transcriptional regulation in vivo. A comparative study using an allelic mutant strain with milder corneal phenotypes suggested that the level of filamentous actin may correlate with the level of gene expression changes. Our study shows that Dstn mutations and resultant actin dynamics abnormalities have a strong impact on the gene expression profile in vivo.
Figures


Comment in
-
SRF'ing the actin cytoskeleton with no destrin.Physiol Genomics. 2008 Jun 12;34(1):6-8. doi: 10.1152/physiolgenomics.90243.2008. Epub 2008 May 13. Physiol Genomics. 2008. PMID: 18477664 No abstract available.
Similar articles
-
Defects in actin dynamics lead to an autoinflammatory condition through the upregulation of CXCL5.PLoS One. 2008 Jul 16;3(7):e2701. doi: 10.1371/journal.pone.0002701. PLoS One. 2008. PMID: 18628996 Free PMC article.
-
Serum response factor: positive and negative regulation of an epithelial gene expression network in the destrin mutant cornea.Physiol Genomics. 2014 Apr 15;46(8):277-89. doi: 10.1152/physiolgenomics.00126.2013. Epub 2014 Feb 18. Physiol Genomics. 2014. PMID: 24550211 Free PMC article.
-
Differences in corneal phenotypes between destrin mutants are due to allelic difference and modified by genetic background.Mol Vis. 2012;18:606-16. Epub 2012 Mar 3. Mol Vis. 2012. PMID: 22419854 Free PMC article.
-
Functions of actin-interacting protein 1 (AIP1)/WD repeat protein 1 (WDR1) in actin filament dynamics and cytoskeletal regulation.Biochem Biophys Res Commun. 2018 Nov 25;506(2):315-322. doi: 10.1016/j.bbrc.2017.10.096. Epub 2017 Oct 19. Biochem Biophys Res Commun. 2018. PMID: 29056508 Free PMC article. Review.
-
ADF/cofilin: a functional node in cell biology.Trends Cell Biol. 2010 Apr;20(4):187-95. doi: 10.1016/j.tcb.2010.01.001. Epub 2010 Feb 3. Trends Cell Biol. 2010. PMID: 20133134 Free PMC article. Review.
Cited by
-
Cofilin and Actin Dynamics: Multiple Modes of Regulation and Their Impacts in Neuronal Development and Degeneration.Cells. 2021 Oct 12;10(10):2726. doi: 10.3390/cells10102726. Cells. 2021. PMID: 34685706 Free PMC article. Review.
-
The role of actin depolymerizing factor in advanced glycation endproducts-induced impairment in mouse brain microvascular endothelial cells.Mol Cell Biochem. 2017 Sep;433(1-2):103-112. doi: 10.1007/s11010-017-3019-8. Epub 2017 Apr 4. Mol Cell Biochem. 2017. PMID: 28378130
-
Destrin deletion enhances the bone loss in hindlimb suspended mice.Eur J Appl Physiol. 2013 Feb;113(2):403-10. doi: 10.1007/s00421-012-2451-4. Epub 2012 Jul 6. Eur J Appl Physiol. 2013. PMID: 22767153
-
Loss of serum response factor in keratinocytes results in hyperproliferative skin disease in mice.J Clin Invest. 2009 Apr;119(4):899-910. doi: 10.1172/JCI37771. Epub 2009 Mar 23. J Clin Invest. 2009. PMID: 19307725 Free PMC article.
-
Defects in actin dynamics lead to an autoinflammatory condition through the upregulation of CXCL5.PLoS One. 2008 Jul 16;3(7):e2701. doi: 10.1371/journal.pone.0002701. PLoS One. 2008. PMID: 18628996 Free PMC article.
References
-
- Expression Analysis Technical Manual. 2004. Affymetrix I.
-
- Affymetrix I. GeneChip® Expression Analysis Data Analysis Fundamentals. http://www.affymetrix.com/support/technical/manual/expression_manual.affx.
-
- Amano M, Fukata Y, Kaibuchi K. Regulation and functions of Rho-associated kinase. Exp Cell Res. 2000;261:44–51. - PubMed
-
- Ashburner M, Ball CA, Blake JA, Botstein D, Butler H, Cherry JM, Davis AP, Dolinski K, Dwight SS, Eppig JT, Harris MA, Hill DP, Issel-Tarver L, Kasarskis A, Lewis S, Matese JC, Richardson JE, Ringwald M, Rubin GM, Sherlock G. Gene ontology: tool for the unification of biology. The Gene Ontology Consortium. Nat Genet. 2000;25:25–29. - PMC - PubMed
-
- Ayscough KR. In vivo functions of actin-binding proteins. Curr Opin Cell Biol. 1998;10:102–111. - PubMed
Publication types
MeSH terms
Substances
Grants and funding
LinkOut - more resources
Full Text Sources
Molecular Biology Databases
Research Materials
Miscellaneous

