. 2008 Apr 1;22(7):894-907.
doi: 10.1101/gad.1640608.

The miR-200 family determines the epithelial phenotype of cancer cells by targeting the E-cadherin repressors ZEB1 and ZEB2

Affiliations

The miR-200 family determines the epithelial phenotype of cancer cells by targeting the E-cadherin repressors ZEB1 and ZEB2

Sun-Mi Park et al. Genes Dev. .

Erratum in

  • Genes Dev. 2009 Jun 1;23(11):1378

Abstract

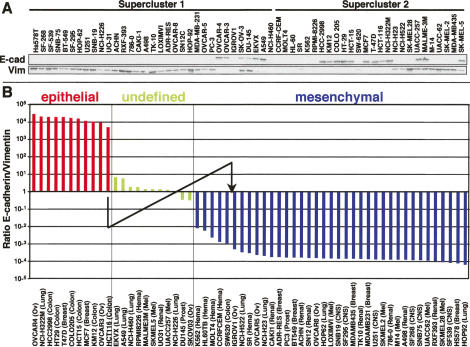
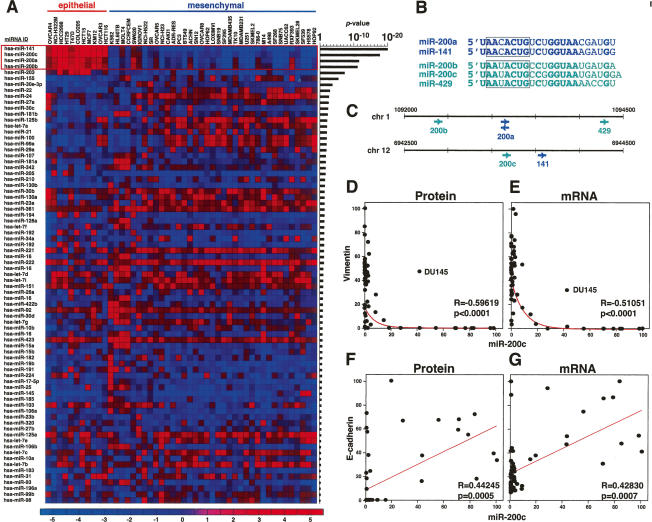
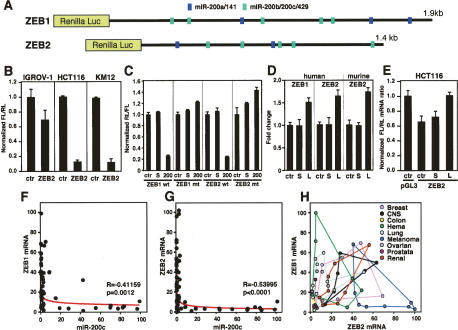
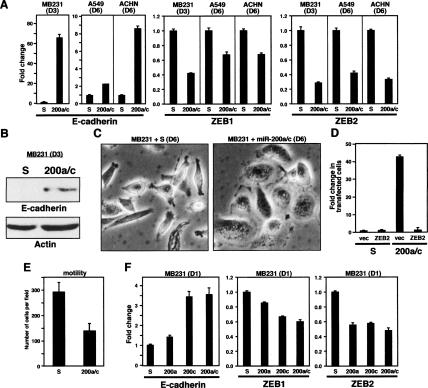
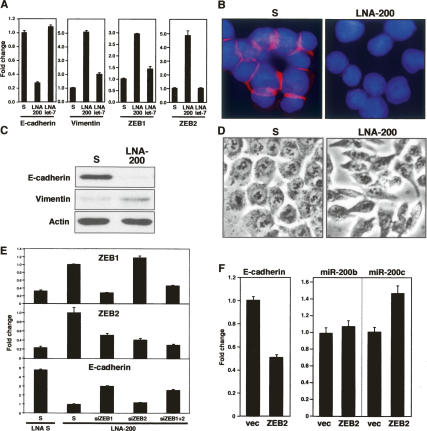
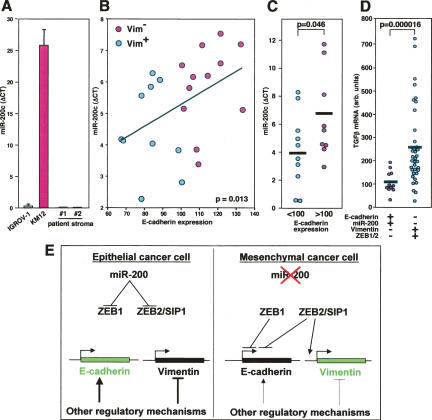
Cancer progression has similarities with the process of epithelial-to-mesenchymal transition (EMT) found during embryonic development, during which cells down-regulate E-cadherin and up-regulate Vimentin expression. By evaluating the expression of 207 microRNAs (miRNAs) in the 60 cell lines of the drug screening panel maintained by the Nation Cancer Institute, we identified the miR-200 miRNA family as an extraordinary marker for cells that express E-cadherin but lack expression of Vimentin. These findings were extended to primary ovarian cancer specimens. miR-200 was found to directly target the mRNA of the E-cadherin transcriptional repressors ZEB1 (TCF8/deltaEF1) and ZEB2 (SMAD-interacting protein 1 [SIP1]/ZFXH1B). Ectopic expression of miR-200 caused up-regulation of E-cadherin in cancer cell lines and reduced their motility. Conversely, inhibition of miR-200 reduced E-cadherin expression, increased expression of Vimentin, and induced EMT. Our data identify miR-200 as a powerful marker and determining factor of the epithelial phenotype of cancer cells.


Figures

Figure 1.
Figure 1.
Identification of E-cadherin-positive and -negative cells among the NCI60 cell lines. (A) Western blot analysis of 59 of the NCI60 cell lines for E-cadherin and Vimentin expression grouped into superclusters. (B) NCI60 cells ranked according to highest to lowest ratio of E-cadherin/Vimentin expression. Epithelial cells express only E-cadherin and mesenchymal cells express only Vimentin. Undefined cell lines express either both markers or neither of them. The E-cadherin/Vimentin ratio was determined using densitometry of the data shown in A. Expression was normalized to actin bands run twice on different gels (not shown). The arrow indicates the change in E-cadherin/Vimentin ratio in HCT116 cells after inhibition of miR-200 as shown in Figure 5A.
Figure 2.
Figure 2.
The miR-200 family of miRNAs is selectively expressed in only E-cadherin-positive and Vimentin-negative cells. (A) Expression of the 77 miRNAs with the highest expression in the NCI60 cells (Shell et al. 2007) ranked according to expression in either epithelial or mesenchymal cell lines. P-values are the result of a two-sample t-test analysis. High expression is indicated in red and low expression is in blue. Fold change (log2) is indicated. (B) The miR-200 family of miRNAs consists of two closely related subfamilies. Identical positions among all five family members are shown in bold. Seed sequences are boxed. (C) The five miR-200 family members are located on two different genetic loci. The correlation to the two functional subfamilies is indicated by using different colors. (D–G) Comparison of Vimentin protein expression (D), Vimentin mRNA expression (E), E-cadherin protein expression (F), and E-cadherin mRNA expression (G) with that of miR-200c in the NCI60 cells. Pearson correlation coefficients (R) and P-values (p) are reported.
Figure 3.
Figure 3.
Endogenous miR-200 targets the mRNAs of ZEB1 and ZEB2. (A) Schematic of the ZEB1 and ZEB2 3′UTRs with the location of the predicted miR-200a/141 (blue) and miR-200b/c/429 (green) target sites. Shown are the luciferase constructs with the human ZEB 3′UTRs. (B) Activity of the firefly luciferase gene linked to the 3′UTR of murine ZEB2 72 h after transfection into cell lines with different endogenous miR-200 levels (IGROV-1, low; HCT116 and KM12, high). (C) 293T cells were transfected with the ZEB Renilla luciferase constructs shown in A or corresponding mutants in which all five miR-200b/c/429 sites were mutated and either left untreated (ctr) or cotransfected with scrambled pre-miR (S) or miR-200c (200). (D) HCT116 cells were transfected with either 10 nM scrambled LNA oligo (S) or LNA-200 (L) or left untreated and cotransfected with luciferase constructs containing either human ZEB1, human ZEB2, or murine ZEB2 3′UTR. (E) Real-time PCR to quantify luciferase mRNA in HCT116 cells transfected with either empty luciferase vector (pGL3) or the murine ZEB2 luciferase construct. Cells were either left untreated or cotransfected with either 50 nM scrambled LNA oligo (S) or LNA-miR-200 (L). (F) Comparison of the ZEB1 mRNA expression with that of miR-200c in the NCI60 cells. (G) Comparison of the ZEB2 mRNA expression with that of miR-200c in the NCI60 cells. Pearson correlation coefficients (R) and P-values (p) are reported. (H) Comparison of the ZEB1 mRNA expression with that of the mRNA of ZEB2 in the NCI60 cells. Cells from nine different cancer origins are labeled in different colors.
Figure 4.
Figure 4.
Induction of E-cadherin expression and MET in established cancer cell lines by introducing exogenous miR-200. (A) Cells were transfected with either scrambled pre-miRNA (S) or a mixture of pre-miR-200a and pre-miR-200c (200a/c). Expression of E-cadherin, ZEB1, and ZEB2 was determined by real-time PCR either 3 d (D3) or 6 d (D6) after the first transfection. (B) Detection of E-cadherin by Western blot analysis in MDA-MB-231 cells 3 d after transfecting scrambled oligo (S) or miR-200a/c. (C) Morphological changes of the cells after treatment as in B after 6 d. (D) MDA-MB-231 cells that had received six cycles of transfection were first transfected with either scrambled pre-miR oligo or miR-200a/c to further induce E-cadherin expression, and after 24 h were transfected with control vector or ZEB2 expression plasmid. Three days later, E-cadherin expression was quantified by real-time PCR. Numbers were normalized to a transfection efficiency of 23%. (E) Twenty-two-hour in vitro motility assay of MDA-MB-231 cells transfected three times (D9) with either 50 nM scrambled oligo (S) or miR-200a/c. (F) MDA-MB-231 cells were transfected with either scrambled oligo (S), miR-200a (200a), or miR-200c (200c) individually or in combination (200a/c), and after 24 h the expression of E-cadherin, ZEB1, and ZEB2 was quantified by real-time PCR.
Figure 5.
Figure 5.
Reducing endogenous miR-200 expression induces EMT in HCT116 cells. (A) Cells were transfected repeatedly every 3 d with either scrambled LNA (S), LNA-200, or LNA-let-7 oligo. Expression of mRNAs was quantified by real-time PCR 18 d after the first transfection. (B) Immunofluorescence analysis of E-cadherin expression (pink) in cells repeatedly transfected for 22 d. Cells were counterstained with DAPI. (C) Western blot analysis of cells treated for 15 d. (D) Phase contrast picture showing cells treated for 15 d. (E) Cells were first transfected with either 50 nM LNA scrambled or LNA-200, and after 24 h, once E-cadherin was up-regulated, they were again transfected with either scrambled siRNA pool, a ZEB1-specific siRNA pool, a ZEB2-specific siRNA pool, or both. After 72 h, expression of ZEB1, ZEB2, and E-cadherin was quantified by real-time PCR. (F) Cells were transfected with empty vector (vec) or with HA-ZEB2, and after 3 d expression of E-cadherin, miR-200a, and miR-200c was quantified by real-time PCR. Numbers were normalized to a transfection efficiency of 48%. Expression of HA-ZEB2 was confirmed by Western blot analysis (not shown).
Figure 6.
Figure 6.
The expression of miR-200c and E-cadherin correlates in tumor tissue samples of ovarian cancer patients. (A) Real-time PCR analysis of miR-200c in IGROV-1 and KM12 cells and two patient stroma samples. (B,C) Correlation between the expression of miR-200c and E-cadherin mRNA in two sets of patient samples. Tumors were enriched using method 1 (B) or method 2 (C) as described in Materials and Methods. Linear regression is shown in B, as well as the P-value of the significance of difference in expression of miR-200c in E-cadherin high/Vimentin low (red symbols) and E-cadherin low/Vimentin high (blue symbols) specimens. (D) TGFβ1 mRNA expression in the two groups among the NCI60 cells with the indicated expression pattern. The P-value of the difference in expression between the two groups is shown. (E) Model to explain the function of miR-200 in maintaining an epithelial phenotype of cancer cells. See the text for details.

Comment in

References

    1. Aigner K., Dampier B., Descovich L., Mikula M., Sultan A., Schreiber M., Mikulits W., Brabletz T., Strand D., Obrist P., et al. The transcription factor ZEB1 (δEF1) promotes tumour cell dedifferentiation by repressing master regulators of epithelial polarity. Oncogene. 2007;26:6979–6988. - PMC - PubMed
    1. Akao Y., Nakagawa Y., Naoe T. let-7 microRNA functions as a potential growth suppressor in human colon cancer cells. Biol. Pharm. Bull. 2006;29:903–906. - PubMed
    1. Barnhart B.C., Legembre P., Pietras E., Bubici C., Franzoso G., Peter M.E. CD95 ligand induces motility and invasiveness of apoptosis-resistant tumor cells. EMBO J. 2004;23:3175–3185. - PMC - PubMed
    1. Bindels S., Mestdagt M., Vandewalle C., Jacobs N., Volders L., Noel A., van Roy F., Berx G., Foidart J.M., Gilles C. Regulation of vimentin by SIP1 in human epithelial breast tumor cells. Oncogene. 2006;25:4975–4985. - PubMed
    1. Boyerinas B., Park S.M., Shomron N., Hedegaard M.M., Vinther J., Andersen J.A., Feig C., Xu J., Burge C.B., Peter M.E. Identification of Let-7-regulated oncofetal genes. Cancer Res. 2008 (in press) - PubMed

Publication types

MeSH terms