Review
. 2008 Apr;18(4):644-52.
doi: 10.1101/gr.071852.107.

Protein networks in disease

Affiliations
Review

Protein networks in disease

Trey Ideker et al. Genome Res. 2008 Apr.

Abstract

During a decade of proof-of-principle analysis in model organisms, protein networks have been used to further the study of molecular evolution, to gain insight into the robustness of cells to perturbation, and for assignment of new protein functions. Following these analyses, and with the recent rise of protein interaction measurements in mammals, protein networks are increasingly serving as tools to unravel the molecular basis of disease. We review promising applications of protein networks to disease in four major areas: identifying new disease genes; the study of their network properties; identifying disease-related subnetworks; and network-based disease classification. Applications in infectious disease, personalized medicine, and pharmacology are also forthcoming as the available protein network information improves in quality and coverage.


Figures
Box 1.
Box 1.
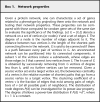
Network properties
Figure 1.
Figure 1.
Differentially expressed cancer genes tend toward higher network connectivity. Human proteins of each network degree (X-axis) were analyzed to compute their fraction of genes up-regulated (A) or down-regulated (B) in the microarray profiles of five lung cancer tissue biopsies. Both up- and down-regulated genes show significant positive correlation to protein degree, in contrast to the set of all genes on the microarray (C). Reproduced from Wachi et al. (2005) and reprinted with permission from Oxford University Press © 2005.
Figure 2.
Figure 2.
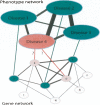
A gene-phenotype network. Shown is a combined gene–gene, gene–phenotype, and phenotype–phenotype interaction network. In this hypothetical example, diseases 1, 2, and 3 have known causative genes (genes A, C, and E, respectively), and are all phenotypically related to disease 4, which lacks an identified causative gene. If the known causative genes are functionally closely related, as in this case, then candidate genes (genes B and D) can be hypothesized for disease 4 due to their close functional relationships to the known genes of the phenotypically related diseases. Black lines of varying thickness indicate the degree of phenotypic and functional similarity between diseases and genes, respectively. Reproduced from Oti and Brunner (2007) and reprinted with permission from Blackwell Publishing Ltd. © 2007 (www.blackwell-synergy.com).
Figure 3.
Figure 3.
A protein interaction network for Huntington disease. (Red diamonds) Y2H interactors of huntingtin (HTT) newly identified by the Goehler et al. (2004) study. (Blue squares) Previously published interactors. (Green triangles) Interactors culled from human protein interaction databases (HRPD) (Gandhi et al. 2006), MINT (Chatr-aryamontri et al. 2007), and BIND (Bader et al. 2003). (Red squares) HTT interactors that were both newly identified and previously reported. Reproduced from Goehler et al. (2004) and reprinted with permission from Elsevier Ltd. © 2004.
Figure 4.
Figure 4.
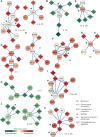
Discriminative subnetworks enriched with hallmarks of cancer. Vertices and edges represent human proteins and protein interactions, respectively. The color of each node scales with the change in expression of the corresponding gene for metastatic (red) versus nonmetastatic (green) cancer. The shape of each node indicates whether its gene is significantly differentially expressed (diamond; P <0.05 from a two-tailed t-test) or not (circle). The predominant cellular functions are indicated next to each module, and known breast cancer susceptibility genes are marked by a blue asterisk. Reproduced from Chuang et al. (2007) with permission from Macmillan Publishers Ltd. © 2007.

References

    1. Alon U. Introduction to systems biology: Design principles of biological circuits. Chapman and Hall; London, UK: 2006.
    1. Bader G.D., Betel D., Hogue C.W. BIND: The Biomolecular Interaction Network Database. Nucleic Acids Res. 2003;31:248–250. - PMC - PubMed
    1. Bader J.S., Chaudhuri A., Rothberg J.M., Chant J. Gaining confidence in high-throughput protein interaction networks. Nat. Biotechnol. 2004;22:78–85. - PubMed
    1. Bandyopadhyay S., Sharan R., Ideker T. Systematic identification of functional orthologs based on protein network comparison. Genome Res. 2006;16:428–435. - PMC - PubMed
    1. Barabasi A.L., Oltvai Z.N. Network biology: Understanding the cell's functional organization. Nat. Rev. Genet. 2004;5:101–113. - PubMed

Publication types

Substances

LinkOut - more resources