

The future is now - will the real disease gene please stand up?
- PMID: 18382092
- PMCID: PMC2861528
- DOI: 10.1159/000119112
The future is now - will the real disease gene please stand up?
Abstract
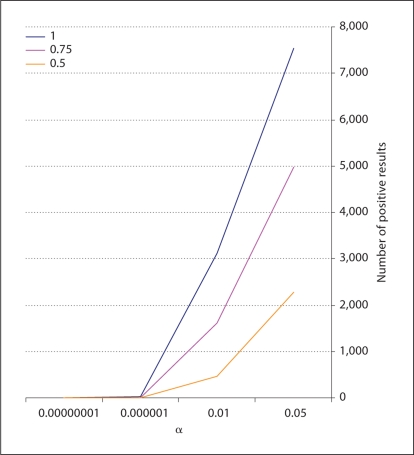
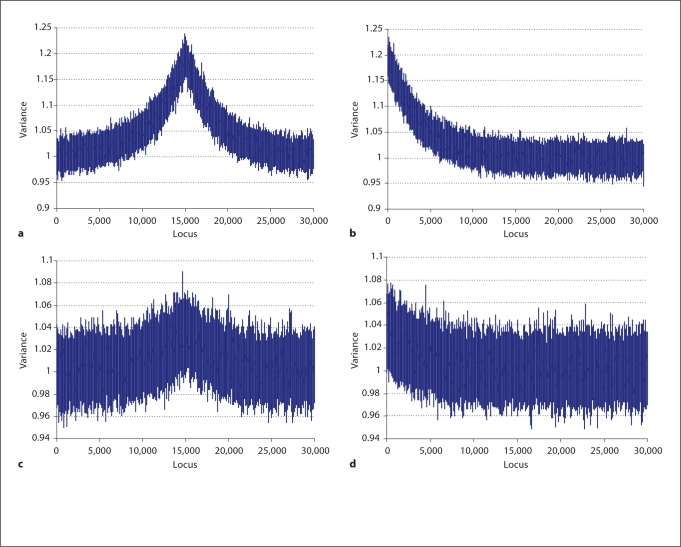
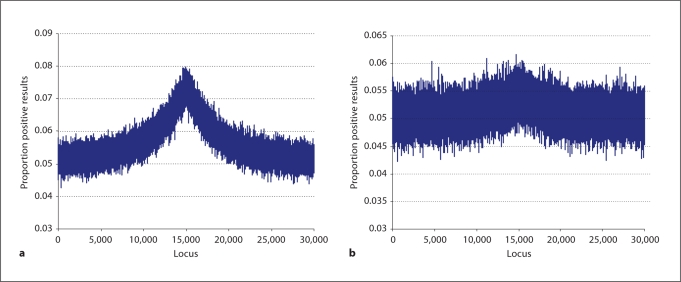
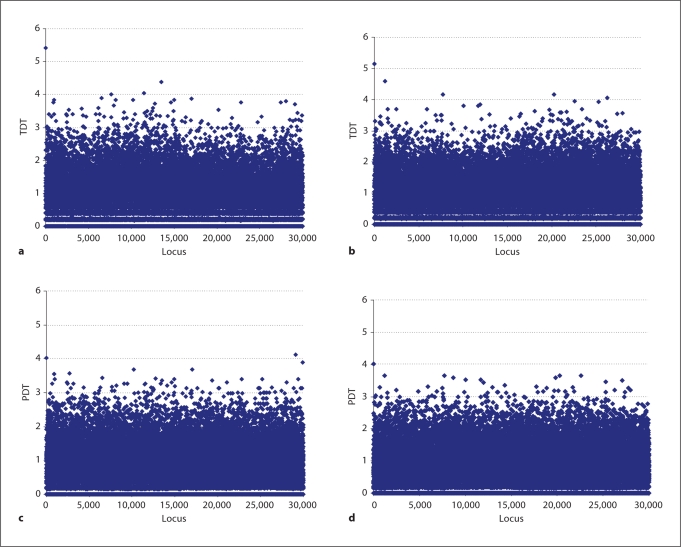
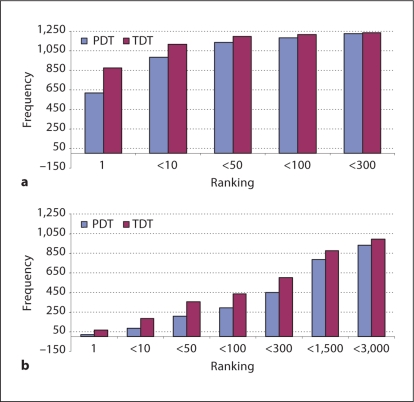
The transmission/disequilibrium test (TDT) [Spielman et al.: Am J Hum Genet 1993;52:506-516] has been postulated as the future of gene mapping for complex diseases, provided one is able to genotype a dense enough map of markers across the genome. Risch and Merikangas [Science 1996;273:1516-1517] suggested a million-marker screen in affected sibpair (ASP) families, demonstrating that the TDT is a more powerful test of linkage than traditional linkage tests based on allele-sharing when there is also association between marker and disease alleles. While the future of genotyping has arrived, successes in family-based association studies have been modest. This is often attributed to excessive false positives in candidate gene studies. This problem is only exacerbated by the increasing numbers of whole genome association (WGA) screens. When applied in ASPs, the TDT statistic, which assumes transmissions to siblings are independent, is not expected to have a constant variance in the presence of variable linkage. This results in generally more extreme statistics, hence will further aggravate the problem of having a large number of positive results to sort through. So an important question is how many positive TDT results will show up on a chromosome containing a disease gene due only to linkage, and will they obfuscate the true disease gene location. To answer this question we combined theory and computer simulations. These studies show that in ASPs the normal version of the TDT statistic has a mean of 0 and a variance of 1 in unlinked regions, but has a variance larger than 1 in linked regions. In contrast, the pedigree disequilibrium test (PDT) statistic adjusts for correlation between siblings due to linkage and maintains a constant variance of 1 at unassociated markers irrespective of linkage. The TDT statistic is generally larger than the PDT statistic across linked regions. This is true for unassociated as well as associated markers. To compare the two tests we ranked both statistics at the disease locus, or an associated marker, among statistics at all other markers. The TDT did better job than PDT placing the score of the associated marker near the top. Though, strictly speaking, the TDT in ASPs should be interpreted as a test of linkage and not a test of association, there is a good chance that if a marker stands out, the marker is associated as well as linked. In conclusion, our results suggest that TDT is an effective screening tool for WGA studies, especially in multiplex families.
(c) 2008 S. Karger AG, Basel
Figures
Similar articles
-
Exploiting excess sharing: a more powerful test of linkage for affected sib pairs than the transmission/disequilibrium test.Am J Hum Genet. 2000 Jun;66(6):2005-8. doi: 10.1086/302912. Epub 2000 Apr 28. Am J Hum Genet. 2000. PMID: 10788332 Free PMC article.
-
Hidden linkage: a comparison of the affected sib pair (ASP) test and transmission/disequilibrium test (TDT).Ann Hum Genet. 1998 Mar;62(Pt 2):159-79. doi: 10.1046/j.1469-1809.1998.6220159.x. Ann Hum Genet. 1998. PMID: 9759477
-
Informative-transmission disequilibrium test (i-TDT): combined linkage and association mapping that includes unaffected offspring as well as affected offspring.Genet Epidemiol. 2007 Feb;31(2):115-33. doi: 10.1002/gepi.20195. Genet Epidemiol. 2007. PMID: 17123304
-
Multipoint linkage disequilibrium mapping approach: incorporating evidence of linkage and linkage disequilibrium from unlinked region.Genet Epidemiol. 2003 Jul;25(1):1-13. doi: 10.1002/gepi.10241. Genet Epidemiol. 2003. PMID: 12813722 Review.
-
The relative power of family-based and case-control designs for linkage disequilibrium studies of complex human diseases I. DNA pooling.Genome Res. 1998 Dec;8(12):1273-88. doi: 10.1101/gr.8.12.1273. Genome Res. 1998. PMID: 9872982 Review.
References
Publication types
MeSH terms
Substances
Grants and funding
LinkOut - more resources
Full Text Sources
Medical
