

An analysis of genetic diversity and inbreeding in Wuchereria bancrofti: implications for the spread and detection of drug resistance
- PMID: 18382607
- PMCID: PMC2275205
- DOI: 10.1371/journal.pntd.0000211
An analysis of genetic diversity and inbreeding in Wuchereria bancrofti: implications for the spread and detection of drug resistance
Abstract
Estimates of genetic diversity in helminth infections of humans often have to rely on genotyping (immature) parasite transmission stages instead of adult worms. Here we analyse the results of one such study investigating a single polymorphic locus (a change at position 200 of the beta-tubulin gene) in microfilariae of the lymphatic filarial parasite Wuchereria bancrofti. The presence of this genetic change has been implicated in benzimidazole resistance in parasitic nematodes of farmed ruminants. Microfilariae were obtained from patients of three West African villages, two of which were sampled prior to the introduction of mass drug administration. An individual-based stochastic model was developed showing that a wide range of allele frequencies in the adult worm populations could have generated the observed microfilarial genetic diversity. This suggests that appropriate theoretical null models are required in order to interpret studies that genotype transmission stages. Wright's hierarchical F-statistic was used to investigate the population structure in W. bancrofti microfilariae and showed significant deficiency of heterozygotes compared to the Hardy-Weinberg equilibrium; this may be partially caused by a high degree of parasite genetic differentiation between hosts. Studies seeking to quantify accurately the genetic diversity of helminth populations by analysing transmission stages should increase their sample size to account for the variability in allele frequency between different parasite life-stages. Helminth genetic differentiation between hosts and non-random mating will also increase the number of hosts (and the number of samples per host) that need to be genotyped, and could enhance the rate of spread of anthelmintic resistance.
Conflict of interest statement
The authors have declared that no competing interests exist.
Figures
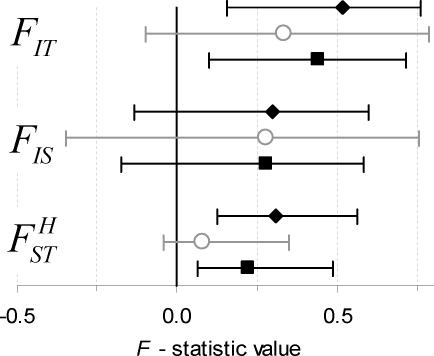
 shows the variation in microfilarial allele frequency within the host subpopulation (village).
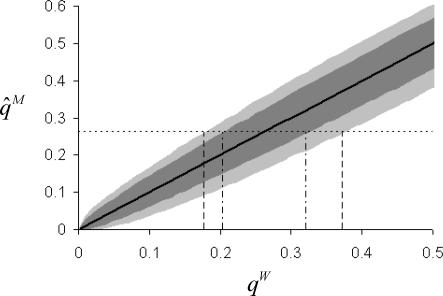
 , light grey shaded area). Simulations are based on the same sampling scheme used in Burkina Faso . The thick black solid line indicates the mean result for both models. The observed pre-treatment microfilarial allele frequency (
 ; black thin, horizontal dotted line) was compared to simulation results to indicate the possible range of adult worm allele frequencies which could have given rise to the West African data. The null model (black vertical dotted-dashed lines) indicated values of qW ranging from 0.21 to 0.32 compared to the inbred model (FIS = 0.28,
  , black vertical dashed lines), which gave values of qW between 0.18 and 0.37.
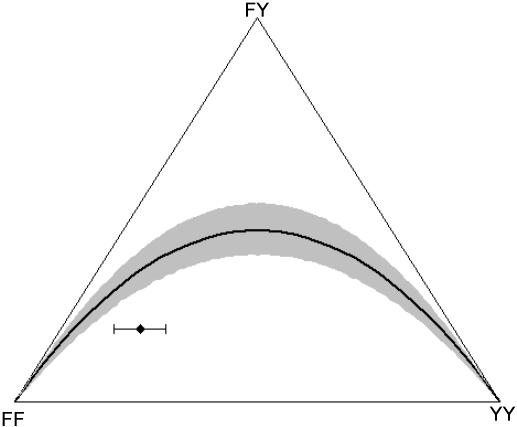
 , and FIT = 0.44), and the error bars indicate the uncertainty in genotype distribution stemming from the values of qW (0.21, 0.32) that were estimated from the null (random) model (Figure 2). Y indicates the allele coding for tyrosine at position 200 of β-tubulin that is associated with benzimidazole (BZ) resistance in nematodes of livestock, and F denotes the allele (coding for phenylalanine) indicative of BZ susceptibility. The solid-black curve represents the Hardy-Weinberg equilibrium (HWE). The null model generating microfilarial allele frequencies (see text) was used to investigate the range of sample microfilarial genotype distributions that could be obtained from a population exhibiting no excess inbreeding (i.e. assuming that the underlying adult parasite population would have values of
  ). Simulations mimic the same sampling scheme described in Schwab et al. The observed microfilarial genotype distribution falls outside the 95% confidence interval range (grey shaded area surrounding the HWE curve) generated by the null model, despite the uncertainty in the underlying qW estimates, indicating strong parasite inbreeding even before introduction of antifilarial combination therapy.
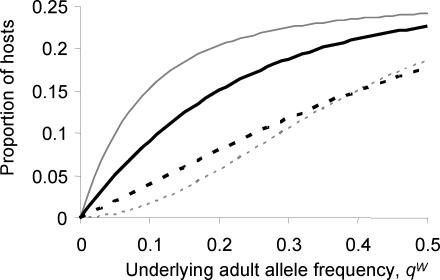
 ) observed in the Burkina Faso data. Simulations used the same sampling scheme described in Schwab et al.
and assume an overall microfilarial prevalence of ∼25% (see text).
) observed in the Burkina Faso data. Simulations used the same sampling scheme described in Schwab et al.
and assume an overall microfilarial prevalence of ∼25% (see text).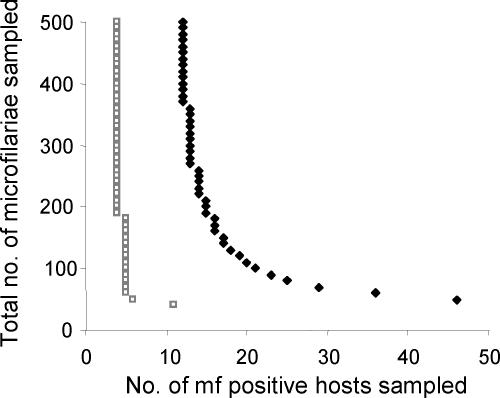
 , grey open squares) is compared to an inbred population (FIS = 0.28 and
  , black diamonds). The underlying adult worm allele frequency of both populations is set at qW = 0.05. Each data point represents 100,000 runs of the stochastic model generating microfilarial allele frequencies. The number of microfilariae analysed per host is proportional to host microfilaraemia.
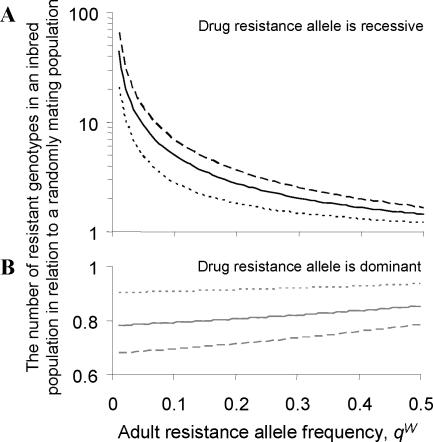
 in (A) and
  in (B).
Similar articles
-
Detection of benzimidazole resistance-associated mutations in the filarial nematode Wuchereria bancrofti and evidence for selection by albendazole and ivermectin combination treatment.Am J Trop Med Hyg. 2005 Aug;73(2):234-8. Am J Trop Med Hyg. 2005. PMID: 16103581
-
An allele specific PCR assay for screening for drug resistance among Wuchereria bancrofti populations in India.Indian J Med Res. 2009 Aug;130(2):193-9. Indian J Med Res. 2009. PMID: 19797818
-
Population genetics of concurrent selection with albendazole and ivermectin or diethylcarbamazine on the possible spread of albendazole resistance in Wuchereria bancrofti.Parasitology. 2006 Nov;133(Pt 5):589-601. doi: 10.1017/S003118200600076X. Epub 2006 Jul 12. Parasitology. 2006. PMID: 16834821
-
Does longevity of adult Wuchereria bancrofti increase with decreasing intensity of parasite transmission? Insights from clinical observations.Trans R Soc Trop Med Hyg. 2005 Dec;99(12):883-92. doi: 10.1016/j.trstmh.2005.05.006. Epub 2005 Sep 13. Trans R Soc Trop Med Hyg. 2005. PMID: 16165175 Review.
-
Molecular approaches to studying benzimidazole resistance in trichostrongylid nematode parasites of small ruminants.Vet Parasitol. 2001 Nov 22;101(3-4):405-14. doi: 10.1016/s0304-4017(01)00565-9. Vet Parasitol. 2001. PMID: 11707309 Review.
Cited by
-
A research agenda for helminth diseases of humans: modelling for control and elimination.PLoS Negl Trop Dis. 2012;6(4):e1548. doi: 10.1371/journal.pntd.0001548. Epub 2012 Apr 24. PLoS Negl Trop Dis. 2012. PMID: 22545162 Free PMC article. Review.
-
A research agenda for helminth diseases of humans: basic research and enabling technologies to support control and elimination of helminthiases.PLoS Negl Trop Dis. 2012;6(4):e1445. doi: 10.1371/journal.pntd.0001445. Epub 2012 Apr 24. PLoS Negl Trop Dis. 2012. PMID: 22545160 Free PMC article. Review.
-
Assessing Onchocerca volvulus Intensity of Infection and Genetic Diversity Using Mitochondrial Genome Sequencing of Single Microfilariae Obtained before and after Ivermectin Treatment.Pathogens. 2023 Jul 24;12(7):971. doi: 10.3390/pathogens12070971. Pathogens. 2023. PMID: 37513818 Free PMC article.
-
The genetic diversity of Oncomelania hupensis robertsoni, intermediate hosts of Schistosoma japonicum in hilly regions of China, using microsatellite markers.Parasit Vectors. 2024 Mar 21;17(1):147. doi: 10.1186/s13071-024-06227-3. Parasit Vectors. 2024. PMID: 38515113 Free PMC article.
-
Molecular epidemiology, phylogeny and evolution of the filarial nematode Wuchereria bancrofti.Infect Genet Evol. 2014 Dec;28:33-43. doi: 10.1016/j.meegid.2014.08.018. Epub 2014 Aug 29. Infect Genet Evol. 2014. PMID: 25176600 Free PMC article. Review.
References
-
- Lammie PJ, Fenwick A, Utzinger J. A blueprint for success: integration of neglected tropical disease control programmes. Trends Parasitol. 2006;22:313–321. - PubMed
-
- WHO. Weekly Epidemiological Record, 2006;2 June 22:221–232. - PubMed
-
- Roos MH, Kwa MSG, Grant WN. New genetic and practical implications of selection for anthelmintic resistance in parasitic nematodes. Parasitol Today. 1995;11:148–150.
-
- Albonico M, Wright V, Bickle Q. Molecular analysis of the beta-tubulin gene of human hookworms as a basis for possible benzimidazole resistance on Pemba Island. Mol Biochem Parasitol. 2004;134:281–284. - PubMed
-
- Ardelli BF, Guerriero SB, Prichard RK. Characterization of a half-size ATP-binding cassette transporter gene which may be a useful marker for ivermectin selection in Onchocerca volvulus. Mol Biochem Parasitol. 2006;145:94–100. - PubMed
Publication types
MeSH terms
Substances
Grants and funding
LinkOut - more resources
Full Text Sources
Other Literature Sources
