

Inevitable evolutionary temporal elements in neural processing: a study based on evolutionary simulations
- PMID: 18382654
- PMCID: PMC2268971
- DOI: 10.1371/journal.pone.0001863
Inevitable evolutionary temporal elements in neural processing: a study based on evolutionary simulations
Abstract
Recent studies have suggested that some neural computational mechanisms are based on the fine temporal structure of spiking activity. However, less effort has been devoted to investigating the evolutionary aspects of such mechanisms. In this paper we explore the issue of temporal neural computation from an evolutionary point of view, using a genetic simulation of the evolutionary development of neural systems. We evolve neural systems in an environment with selective pressure based on mate finding, and examine the temporal aspects of the evolved systems. In repeating evolutionary sessions, there was a significant increase during evolution in the mutual information between the evolved agent's temporal neural representation and the external environment. In ten different simulated evolutionary sessions, there was an increased effect of time-related neural ablations on the agents' fitness. These results suggest that in some fitness landscapes the emergence of temporal elements in neural computation is almost inevitable. Future research using similar evolutionary simulations may shed new light on various biological mechanisms.
Conflict of interest statement
Figures

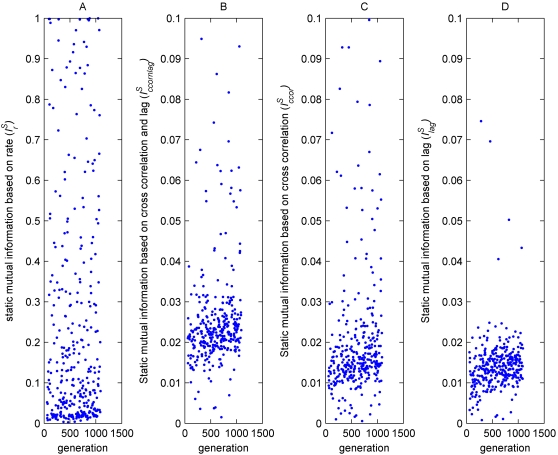
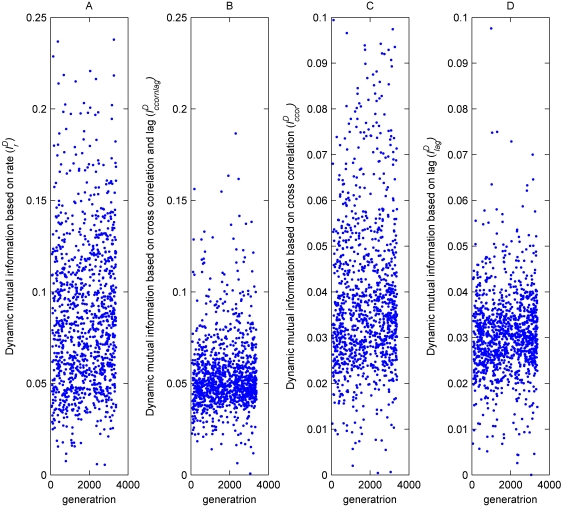
 has higher values than the other measures, but no significant correlation was observed with generation (P = 0.7087, r = 2×10⁻²). B) Measure based on cross correlation combined with lag
  . C) Measure based on cross correlation alone
  . D) Measure based on lag alone
  . All values are based on Spearman's Rank Correlation Test made on 340 randomly chosen agents from the same evolutionary session. Please note the different axis in A.
 has higher values than the other measures, with a significant correlation
  . B) Measure based on cross correlation combined with lag
  . C) Measure based on cross correlation alone
  . D) Measure based on lag alone
  . All values are based on Spearman's Rank Correlation Test made on randomly chosen agents from the same evolutionary session. Since the cross correlation based measures
  reached a plateau earlier than the others, their statistical tests were based on the first 2700 generations whereas the other tests were based on the entire evolutionary session. Please note the different axis in A and B.
Similar articles
-
Good vibrations switch attention: an affective function for network oscillations in evolutionary simulations.Cogn Affect Behav Neurosci. 2010 May;10(2):217-29. doi: 10.3758/CABN.10.2.217. Cogn Affect Behav Neurosci. 2010. PMID: 20498346
-
Autonomous evolution of topographic regularities in artificial neural networks.Neural Comput. 2010 Jul;22(7):1860-98. doi: 10.1162/neco.2010.06-09-1042. Neural Comput. 2010. PMID: 20235822
-
Born to learn: The inspiration, progress, and future of evolved plastic artificial neural networks.Neural Netw. 2018 Dec;108:48-67. doi: 10.1016/j.neunet.2018.07.013. Epub 2018 Aug 7. Neural Netw. 2018. PMID: 30142505 Review.
-
Neural representation of alpha-oriented moving light bars in the cortex: a neural network study.Phys Rev E Stat Nonlin Soft Matter Phys. 2001 Oct;64(4 Pt 1):041916. doi: 10.1103/PhysRevE.64.041916. Epub 2001 Sep 26. Phys Rev E Stat Nonlin Soft Matter Phys. 2001. PMID: 11690061
-
Biological computation through recurrence.Biochem Biophys Res Commun. 2024 Oct 8;728:150301. doi: 10.1016/j.bbrc.2024.150301. Epub 2024 Jun 28. Biochem Biophys Res Commun. 2024. PMID: 38971000 Review.
Cited by
-
Evolving synaptic plasticity with an evolutionary cellular development model.PLoS One. 2008;3(11):e3697. doi: 10.1371/journal.pone.0003697. Epub 2008 Nov 11. PLoS One. 2008. PMID: 19002249 Free PMC article.
References
-
- J Hertz AK, Palmer R. Introduction to the theory of neural computation. Addison-Wesley; 1991.
-
- Eckhorn R, Bauer R, Jordan W, Brosch M, Kruse W, et al. Coherent oscillations: a mechanism of feature linking in the visual cortex? Multiple electrode and correlation analyses in the cat. Biol Cybern. 1988;60:121–130. - PubMed
-
- Maass W. Networks of Spiking Neurons: The Third Generation of Neural Network Models. Neural Networks. 1997;10:1659–1671.
-
- Villa AE, Abeles M. Evidence for spatiotemporal firing patterns within the auditory thalamus of the cat. Brain Res. 1990;509:325–327. - PubMed
-
- Abeles M, Bergman H, Margalit E, Vaadia E. Spatiotemporal firing patterns in the frontal cortex of behaving monkeys. J Neurophysiol. 1993;70:1629–1638. - PubMed
Publication types
MeSH terms
LinkOut - more resources
Full Text Sources
