

Ethnic related selection for an ADH Class I variant within East Asia
- PMID: 18382665
- PMCID: PMC2268739
- DOI: 10.1371/journal.pone.0001881
Ethnic related selection for an ADH Class I variant within East Asia
Abstract
Background: The alcohol dehydrogenases (ADH) are widely studied enzymes and the evolution of the mammalian gene cluster encoding these enzymes is also well studied. Previous studies have shown that the ADH1B*47His allele at one of the seven genes in humans is associated with a decrease in the risk of alcoholism and the core molecular region with this allele has been selected for in some East Asian populations. As the frequency of ADH1B*47His is highest in East Asia, and very low in most of the rest of the world, we have undertaken more detailed investigation in this geographic region.
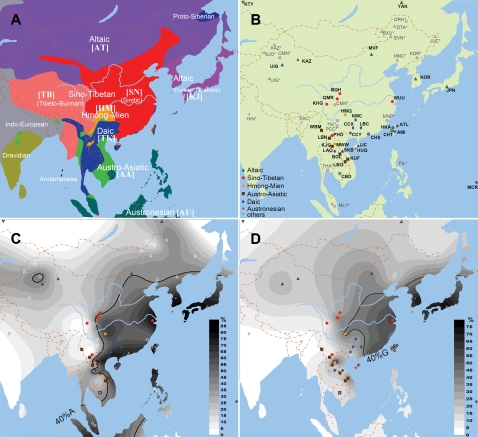
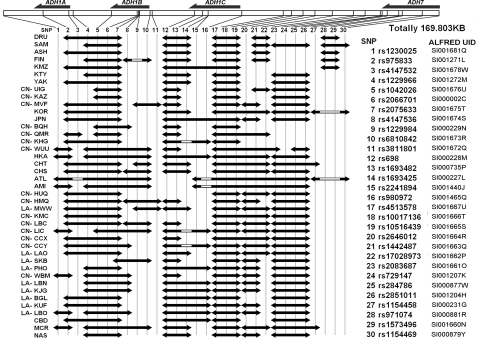
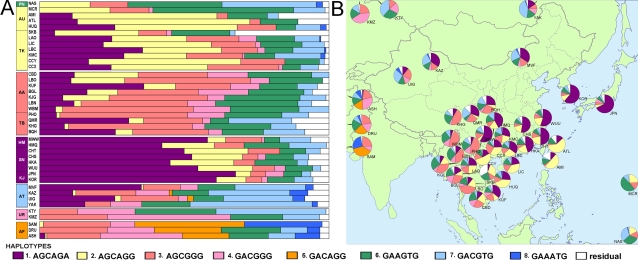
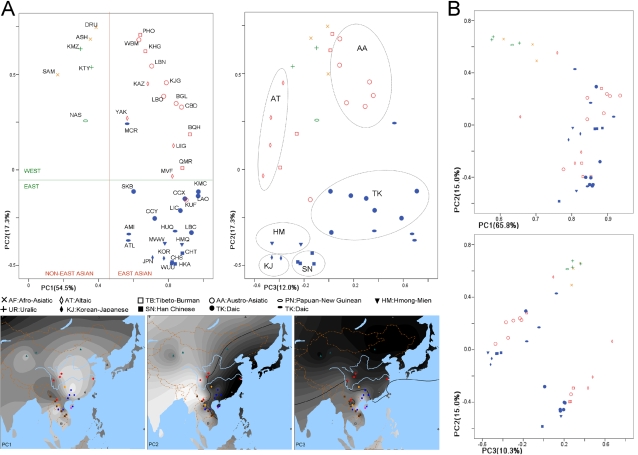
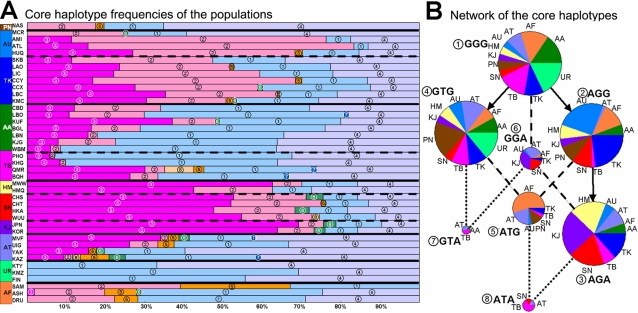
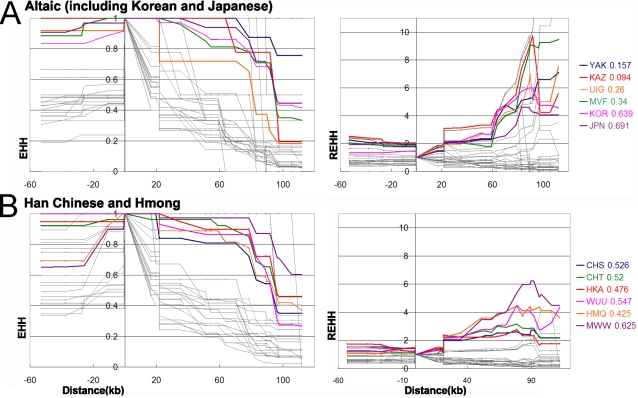
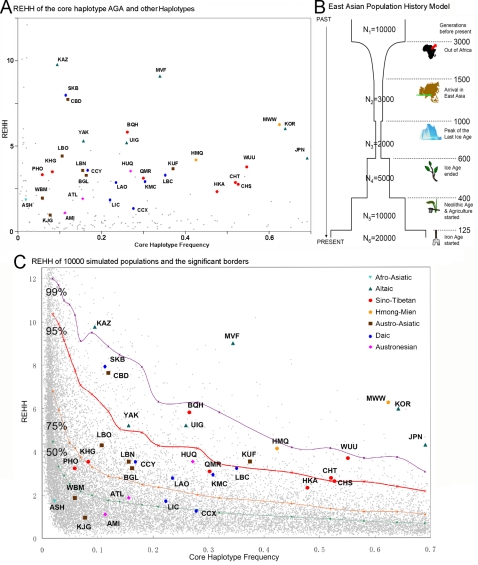
Methodology/principal findings: Here we report new data on 30 SNPs in the ADH7 and Class I ADH region in samples of 24 populations from China and Laos. These populations cover a wide geographic region and diverse ethnicities. Combined with our previously published East Asian data for these SNPs in 8 populations, we have typed populations from all of the 6 major linguistic phyla (Altaic including Korean-Japanese and inland Altaic, Sino-Tibetan, Hmong-Mien, Austro-Asiatic, Daic, and Austronesian). The ADH1B genotyping data are strongly related to ethnicity. Only some eastern ethnic phyla or subphyla (Korean-Japanese, Han Chinese, Hmong-Mien, Daic, and Austronesian) have a high frequency of ADH1B*47His. ADH1B haplotype data clustered the populations into linguistic subphyla, and divided the subphyla into eastern and western parts. In the Hmong-Mien and Altaic populations, the extended haplotype homozygosity (EHH) and relative EHH (REHH) tests for the ADH1B core were consistent with selection for the haplotype with derived SNP alleles. In the other ethnic phyla, the core showed only a weak signal of selection at best.
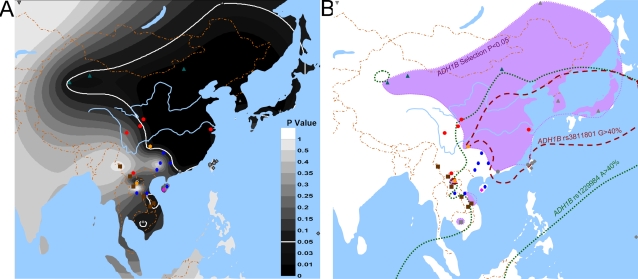
Conclusions/significance: The selection distribution is more significantly correlated with the frequency of the derived ADH1B regulatory region polymorphism than the derived amino-acid altering allele ADH1B*47His. Thus, the real focus of selection may be the regulatory region. The obvious ethnicity-related distributions of ADH1B diversities suggest the existence of some culture-related selective forces that have acted on the ADH1B region.
Conflict of interest statement
Figures
Similar articles
-
The ADH1B Arg47His polymorphism in east Asian populations and expansion of rice domestication in history.BMC Evol Biol. 2010 Jan 20;10:15. doi: 10.1186/1471-2148-10-15. BMC Evol Biol. 2010. PMID: 20089146 Free PMC article.
-
Evidence of positive selection on a class I ADH locus.Am J Hum Genet. 2007 Mar;80(3):441-56. doi: 10.1086/512485. Epub 2007 Jan 30. Am J Hum Genet. 2007. PMID: 17273965 Free PMC article.
-
Diversification of the ADH1B gene during expansion of modern humans.Ann Hum Genet. 2011 Jul;75(4):497-507. doi: 10.1111/j.1469-1809.2011.00651.x. Epub 2011 May 18. Ann Hum Genet. 2011. PMID: 21592108 Free PMC article.
-
Possible epistatic role of ADH7 in the protection against alcoholism.Am J Med Genet B Neuropsychiatr Genet. 2004 Apr 1;126B(1):19-22. doi: 10.1002/ajmg.b.20136. Am J Med Genet B Neuropsychiatr Genet. 2004. PMID: 15048643 Review.
-
ALDH2, ADH1B, and ADH1C genotypes in Asians: a literature review.Alcohol Res Health. 2007;30(1):22-7. Alcohol Res Health. 2007. PMID: 17718397 Free PMC article. Review.
Cited by
-
The ADH1B Arg47His polymorphism in east Asian populations and expansion of rice domestication in history.BMC Evol Biol. 2010 Jan 20;10:15. doi: 10.1186/1471-2148-10-15. BMC Evol Biol. 2010. PMID: 20089146 Free PMC article.
-
A single nucleotide polymorphism in the alcohol dehydrogenase 7 gene (alanine to glycine substitution at amino acid 92) is associated with the risk of squamous cell carcinoma of the head and neck.Cancer. 2010 Jun 15;116(12):2984-92. doi: 10.1002/cncr.25058. Cancer. 2010. PMID: 20336794 Free PMC article.
-
Population genomics advances in frontier ethnic minorities in China.Sci China Life Sci. 2025 Apr;68(4):961-973. doi: 10.1007/s11427-024-2659-2. Epub 2024 Dec 4. Sci China Life Sci. 2025. PMID: 39643831 Review.
-
Evolution in health and medicine Sackler colloquium: Making evolutionary biology a basic science for medicine.Proc Natl Acad Sci U S A. 2010 Jan 26;107 Suppl 1(Suppl 1):1800-7. doi: 10.1073/pnas.0906224106. Epub 2009 Nov 16. Proc Natl Acad Sci U S A. 2010. PMID: 19918069 Free PMC article.
-
Recent Selection on a Class I ADH Locus Distinguishes Southwest Asian Populations Including Ashkenazi Jews.Genes (Basel). 2018 Sep 7;9(9):452. doi: 10.3390/genes9090452. Genes (Basel). 2018. PMID: 30205534 Free PMC article.
References
-
- Agarwal DP, Goedde HW. Pharmacogenetics of alcohol metabolism and alcoholism. Pharmacogenetics. 1992;2:48–62. - PubMed
-
- Ramchandani VA, Bosron WF, Li TK. Research advances in ethanol metabolism. Pathol Biol (Paris) 2001;49:676–682. - PubMed
-
- Yoshida A, Hsu LC, Yasunami M. Genetics of human alcohol-metabolizing enzymes. Prog Nucleic Acid Res Mol Biol. 1991;40:255–287. - PubMed
-
- Triano EA, Slusher LB, Atkins TA, Beneski JT, Gestl SA, et al. Class I Alcohol Dehydorgenase is highly expressed in normal human mammary epithelium but not in invasive breast cancer: Implications for breast carcinogenesis. Cancer Research. 2003;63:3092–3100. - PubMed
-
- Dodd PR, Foley PF, Buckley ST, Eckert AL, Innes DJ. Genes and gene expression in the brain of the alcoholic. Addict Behav. 2004;29:1295–1309. - PubMed
Publication types
MeSH terms
Substances
Grants and funding
LinkOut - more resources
Full Text Sources
Research Materials
