. 2008 Apr 2;3(4):e1884.
doi: 10.1371/journal.pone.0001884.

DJ-1 modulates alpha-synuclein aggregation state in a cellular model of oxidative stress: relevance for Parkinson's disease and involvement of HSP70

Affiliations

DJ-1 modulates alpha-synuclein aggregation state in a cellular model of oxidative stress: relevance for Parkinson's disease and involvement of HSP70

Sara Batelli et al. PLoS One. .

Retraction in

Abstract

Background: Parkinson's disease (PD) is a neurodegenerative pathology whose molecular etiopathogenesis is not known. Novel contributions have come from familial forms of PD caused by alterations in genes with apparently unrelated physiological functions. The gene coding for alpha-synuclein (alpha-syn) (PARK1) has been investigated as alpha-syn is located in Lewy bodies (LB), intraneuronal inclusions in the substantia nigra (SN) of PD patients. A-syn has neuroprotective chaperone-like and antioxidant functions and is involved in dopamine storage and release. DJ-1 (PARK7), another family-PD-linked gene causing an autosomal recessive form of the pathology, shows antioxidant and chaperone-like activities too.

Methodology/principal findings: The present study addressed the question whether alpha-syn and DJ-1 interact functionally, with a view to finding some mechanism linking DJ-1 inactivation and alpha-syn aggregation and toxicity. We developed an in vitro model of alpha-syn toxicity in the human neuroblastoma cell line SK-N-BE, influencing DJ-1 and alpha-syn intracellular concentrations by exogenous addition of the fusion proteins TAT-alpha-syn and TAT-DJ-1; DJ-1 was inactivated by the siRNA method. On a micromolar scale TAT-alpha-syn aggregated and triggered neurotoxicity, while on the nanomolar scale it was neuroprotective against oxidative stress (induced by H(2)O(2) or 6-hydroxydopamine). TAT-DJ-1 increased the expression of HSP70, while DJ-1 silencing made SK-N-BE cells more susceptible to oxidative challenge, rendering TAT-alpha-syn neurotoxic at nanomolar scale, with the appearance of TAT-alpha-syn aggregates.

Conclusion/significance: DJ-1 inactivation may thus promote alpha-syn aggregation and the related toxicity, and in this model HSP70 is involved in the antioxidant response and in the regulation of alpha-syn fibril formation.


Conflict of interest statement

Competing Interests: The authors have declared that no competing interests exist.

Figures

Figure 1
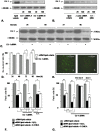
Figure 1. TAT-α-syn and TAT-DJ-1 prevent oxidative stress in SK-N-BE cells.
(A) Dose-response pattern of the toxic effect of hydrogen peroxide (H2O2) in SK-N-BE cells. (B) Dose-response curve of 6-hydroxydopamine (6-OHDA) toxicity in SK-N-BE cells. Cells were plated and challenged by oxidative stress for 24 h and cell viability was assessed by erythrosine-dye exclusion assay; *p<0.05; ***p<0.001 vs control group (0 µM H2O2 or 6-OHDA), Dunnett's post-hoc test. (C) Western blot assessing TAT-α-syn 0.5 µM and TAT-DJ-1 3 µM availability inside SK-N-BE cells. Cells were plated and incubated in presence of TAT-α-syn or TAT-DJ-1 for the reported time intervals. To demonstrate equal gel loading, α-tubulin immunoreactivity is also presented. (D) Protective effect of TAT-delivered α-syn and (E) TAT-delivered DJ-1 against oxidative stress. Cells were incubated with increasing amounts of TAT-α-syn or TAT-DJ-1 2–4 h before the toxic treatment and 24 h later cell viability was assessed by erythrosine-dye exclusion assay; *p<0.05; **p<0.01 vs control group at the same TAT-α-syn or TAT-DJ-1 concentration (CT, corresponding also to 0 µM H2O2 or 6-OHDA), Tukey's post-hoc test. (F) Toxicity of micromolar amounts of TAT-α-syn. Cells were incubated with increasing concentrations of TAT-α-syn for 24 h and cell viability was assessed by erythrosine-dye exclusion assay. **p<0.01 vs control group (CT, corresponding to 0 µM TAT-α-syn), Dunnett's post-hoc test. (G) Amyloid aggregation of TAT-α-syn 3 µM was detected by thioflavin-T staining after 24 h incubation; a) SK-N-BE control cells; b) SK-N-BE cells incubated with TAT-α-syn 3 µM. The arrows indicate intracellular thioflavin-T-positive inclusions (magnification 20X). Owing to concerns about similarities with previously published content in [36], the α-tubulin panel of Figure 1C is excluded from this PLOS ONE article’s CC-BY license; FASEB granted permissions to retain the image in this retracted article. See the accompanying retraction notice for more information.
Figure 2
Figure 2. DJ-1 downregulation by siRNA increases SK-N-BE susceptibility to oxidative challenge.
(A) Preliminary Western blotting experiment aimed at modulating DJ-1 expression by siRNA. Two different siRNAs were tested by exposing SK-N-BE cells to 20 and 100 nM siRNA for 72 h. Each blot lane is representative of a triplicate assay in the same experiment (B) Western blotting assessing the specificity of the proposed silencing method. SK-N-BE cells were exposed for 72 h to β-actin targeted pre-designed siRNA and to a siRNA negative control (CT-) with no sequence similarity to DJ-1 mRNA. Each blot lane is representative of a triplicate assay in the same experiment. (C) Silencing DJ-1 expression by siRNA. Cells were incubated with 100 nM pre-annealed siRNA targeted to DJ-1. Starting 24 h after transfection, DJ-1 protein level was assessed by Western blotting and quantified by a digital image analyzer. The quantification (D) is representative of one of three independent experiments (n = 3 for each point); *p<0.05; **p<0.01 vs control group (siRNA lipid vehicle) at the same time, Tukey's post-hoc test. (E) DJ-1 silencing was also independently assessed by immunocytochemisty: a) SK-N-BE control cells exposed for 72 h to siRNA lipid vehicle alone (magnification 10X); b) SK-N-BE cells incubated for 72 h with 100nM DJ-1 siRNA (magnification 10X). (F) DJ-1 downregulation increases cell susceptibility to oxidative stress. Cells were silenced for DJ-1 expression for 72 h, then the oxidative stimuli were added for a further 24 h. Cell viability was assessed by erythrosine-dye exclusion assay. CT-: siRNA negative control; *p<0.05; **p<0.01 vs control group (siRNA lipid vehicle alone); °p<0.05; °°p<0.01 vs siRNA lipid vehicle+H2O2 or 6-OHDA alone; Tukey' post-hoc test. (G) Specific effect of DJ-1 on oxidative stress response. Cells were silenced for DJ-1 expression for 72 h, then TAT-DJ-1 3 µM or a recombinant DJ-1 at the same concentration (rDJ-1, a purified form of DJ-1 without the TAT sequence) was added 2 h before the oxidative challenge. After 24 h, cell viability was assessed by erythrosine-dye exclusion assay. DJ-1 silencing in the same experiment was confirmed by Western blotting (not shown); **p<0.01 vs control group (siRNA lipid vehicle alone), °p<0.05; °°p<0.01 vs siRNA lipid vehicle+H2O2 or 6-OHDA alone; Tukey's post-hoc test.
Figure 3
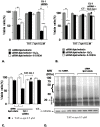
Figure 3. DJ-1 silencing prevents TAT-α-syn protective action and increases its dose-dependent toxicity.
(A) Cells were pre-incubated with TAT-α-syn 0.5 µM for 2 h. Then, the oxidative stimuli were added for a further 24 h. In the DJ-1 silenced group, before TAT-α-syn treatment, DJ-1 expression was silenced for 72 h. Cell viability was assessed by erythrosine-dye exclusion assay; **p<0.01 vs control group (siRNA lipid vehicle alone), Tukey's post-hoc test. (B) Cells were incubated with siRNA negative control (CT-) or with DJ-1 siRNA for 72 h. Then, in the DJ-1 siRNA cells, TAT-DJ-1 3 µM was added to culture medium and after 2 h TAT-α-syn was added to the indicated groups. After 2 h, the oxidative challenge was then carried out for 24 h. Cell viability was assessed by erythrosine-dye exclusion assay. **p<0.01 vs control group (siRNA lipid vehicle alone), Tukey's post-hoc test; #p<0.01, two-way ANOVA for TAT-α-syn (x) TAT-DJ-1. (C) Cells were silenced for DJ-1 expression for 72 h, then TAT-α-syn 0.5 µM was added for 24 h. In the TAT-DJ-1 group, TAT-DJ-1 was added to the culture medium 2 h before TAT-α-syn. CT-: siRNA negative control; **p<0.01 vs control group (no TAT-α-syn added); °p<0.05 vs TAT-α-syn alone; Tukey's post-hoc test; #p<0.01, two-way ANOVA for TAT-α-syn (x) TAT-DJ-1. (D) Western blot showing TAT-α-syn higher-molecular-weight immunoreactive bands after DJ-1 silencing. Cells were silenced for DJ-1 expression for 72 h, after that TAT-α-syn 0.5 µM was added for 24 h. Cell lysates were subjected to gradient SDS-PAGE (5–12%). The arrow indicates the monomeric form of TAT-α-syn around 20 KDa, while the bracket the presence of higher-molecular-weight immunoreactivity. Also α-tubulin immunoreactivity is shown to demonstrate equal gel loading.
Figure 4
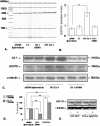
Figure 4. TAT-DJ-1 affects HSP70 mRNA expression.
A) Digital image of a capillary electrophoresis assessing the effect of DJ-1 on HSP70 mRNA expression. Cells were either incubated with TAT-DJ-1 for 24 h or silenced for DJ-1 expression for 72 h. Then total mRNA was extracted, reverse-transcribed and amplified to detect HSP70 (550 bp band) and aldolase-A (180 bp band), used as internal control. The bar graph (B) shows the RT-PCR assay values and is representative of one of three independent experiments (n = 4 for each group). CT-: siRNA negative control; **p<0.01 vs control (siRNA lipid vehicle alone), Tukey's post-hoc test. (C) Western blot showing HSP70 protein expression. Cells were incubated with either TAT-DJ-1 for 24h or DJ-1 siRNA for 72 h, then harvested for Western blotting. The bar graph (D) shows the calculated values normalized to α-tubulin as internal control and is representative of one of three independent experiments (n = 3 for each group); ***p<0.001 vs control group (siRNA lipid vehicle alone), Tukey's post-hoc test. (E) Western blotting assessing HSP70 expression level in SK-N-BE cells incubated with negative control TAT-fused proteins. Cells were incubated with TAT-GFP or TAT-α-syn(1-97) for 24 h and then harvested to perform HSP70 immunodetection. The western blot panels in Figure 4E report material from [36], reproduced with permission of FASEB. The images in Figure 4E are excluded from this PLOS ONE article’s CC-BY license. See the accompanying retraction notice for more information.
Figure 5
Figure 5. DJ-1 silencing prevents TAT-α-syn-mediated HSP70 upregulation.
(A) In the DJ-1 silenced group, SK-N-BE cells were silenced for DJ-1 expression for 72 h, TAT-α-syn 0.5 µM was then added for 24 h and finally cells were harvested for Western blotting to assess HSP70, DJ-1 and TAT-α-syn immunoreactivity. The graph (B) shows blot quantification for HSP70 and DJ-1 expression using α-tubulin as internal standard (n = 3 for each group); **p<0.01, vs control group (siRNA lipid vehicle alone), Tukey's post-hoc test.
Figure 6
Figure 6. Schematic representation of the neuroprotective network against oxidative stress mediated by alpha-synuclein (α-syn) and DJ-1.
Red arrows identify noxious molecular events, while green arrows trace pro-survival cellular mechanisms. The symbol ⊙ stands for “antagonizes”. The free, soluble form of α-syn can be committed to aggregation and the related toxicity by DJ-1 downregulation (upper pathway), maybe through α-syn impaired degradation. In this situation, cell response to oxidative stress is impaired by DJ-1 deficiency, but also by α-syn aggregation-dependent indirect toxicity that prevents the protein neuroprotective role and stops α-syn-mediated HSP70 upregulation at protein level. In addition, α-syn aggregation has a direct toxic effect, probably pro-oxidant, that increases cell damage and triggers a positive feedback loop that promotes further α-syn aggregation. In non-aggregating conditions (lower pathway), in the presence of oxidative stress α-syn promotes cell survival and HSP70 up-regulation (Albani et al., 2004 [36]). In this situation, wild type DJ-1 contributes to keep α-syn in the soluble form. HSP70 is also a downstream molecular target of DJ-1, that increases HSP70 expression preventing α-syn aggregation . DJ-1 pathogenic mutations might impair this function, leading to cell damage through the upper pathway.

Similar articles

Cited by

References

    1. Di Monte DA. The environment and Parkinson's disease: is the nigrostriatal system preferentially targeted by neurotoxins? Lancet Neurol. 2003;2:531–538. - PubMed
    1. Fahn S. Description of Parkinson's disease as a clinical syndrome. Ann N Y Acad Sci. 2003;991:1–14. - PubMed
    1. Hardy J, Cookson MR, Singleton A. Genes and parkinsonism. Lancet Neurol. 2003;2:221–228. - PubMed
    1. Gosal D, Ross OA, Toft M. Parkinson's disease: the genetics of a heterogeneous disorder. Eur J Neurol. 2006;13:616–627. - PubMed
    1. Klein C, Schlossmacher MG. The genetics of Parkinson disease: Implications for neurological care. Nat Clin Pract Neurol. 2006;2:136–146. - PubMed

Publication types

MeSH terms