. 2008 Apr 2;3(4):e1901.
doi: 10.1371/journal.pone.0001901.

Quantitative multicolor compositional imaging resolves molecular domains in cell-matrix adhesions

Affiliations

Quantitative multicolor compositional imaging resolves molecular domains in cell-matrix adhesions

Eli Zamir et al. PLoS One. .

Abstract

Background: Cellular processes occur within dynamic and multi-molecular compartments whose characterization requires analysis at high spatio-temporal resolution. Notable examples for such complexes are cell-matrix adhesion sites, consisting of numerous cytoskeletal and signaling proteins. These adhesions are highly variable in their morphology, dynamics, and apparent function, yet their molecular diversity is poorly defined.

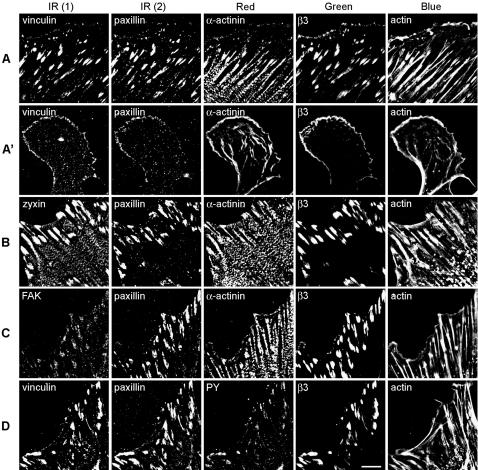
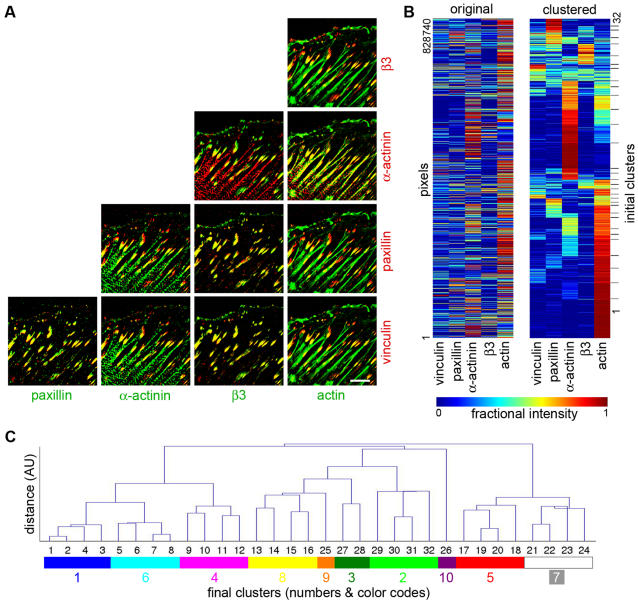
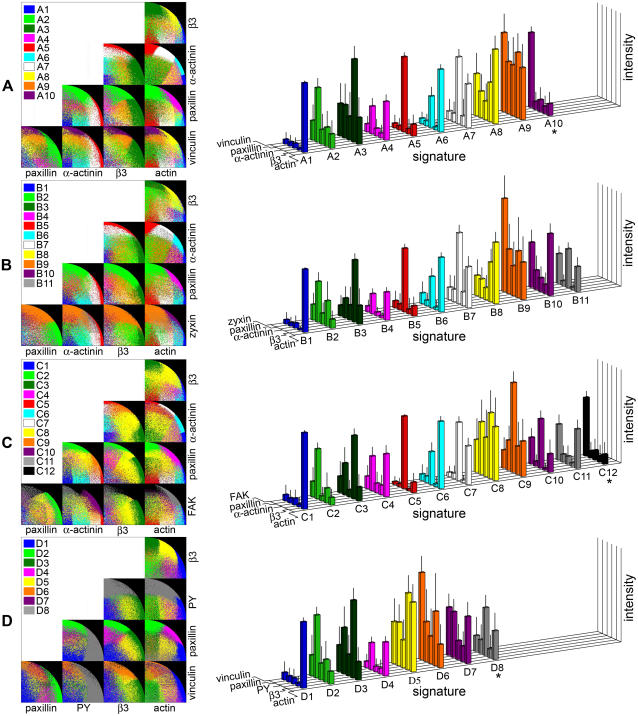
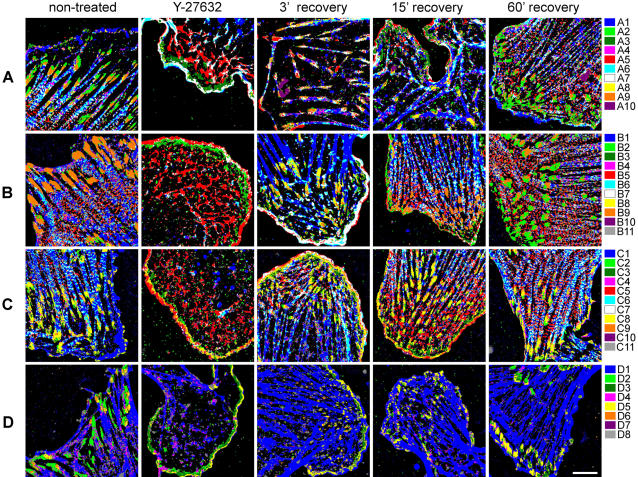
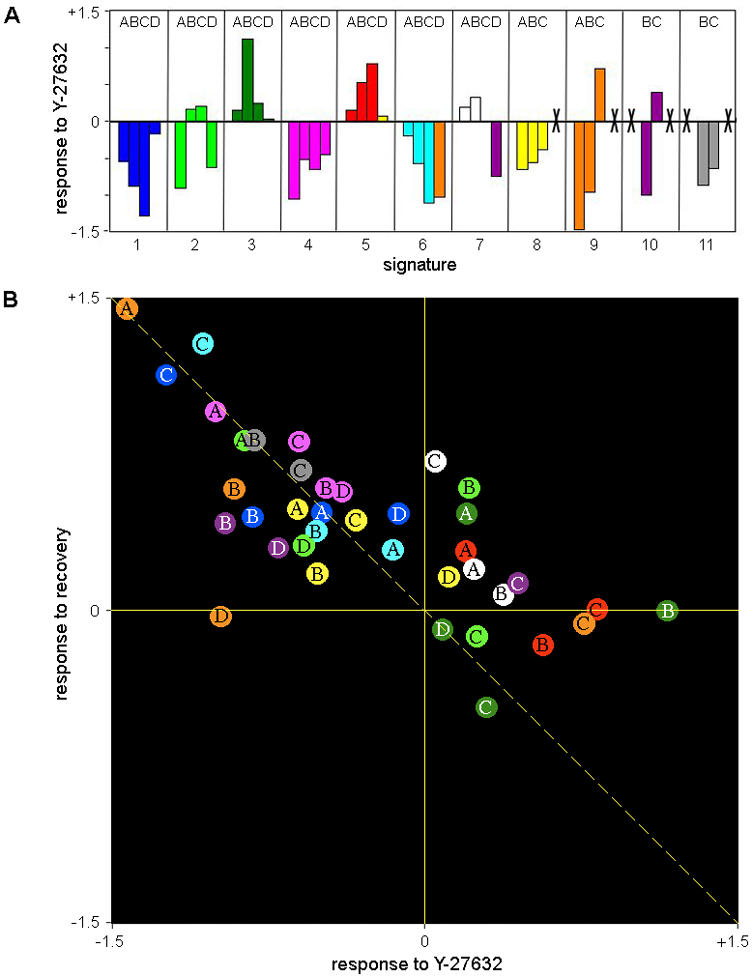
Methodology/principal findings: We present here a compositional imaging approach for the analysis and display of multi-component compositions. This methodology is based on microscopy-acquired multicolor data, multi-dimensional clustering of pixels according to their composition similarity and display of the cellular distribution of these composition clusters. We apply this approach for resolving the molecular complexes associated with focal-adhesions, and the time-dependent effects of Rho-kinase inhibition. We show here compositional variations between adhesion sites, as well as ordered variations along the axis of individual focal-adhesions. The multicolor clustering approach also reveals distinct sensitivities of different focal-adhesion-associated complexes to Rho-kinase inhibition.

Conclusions/significance: Multicolor compositional imaging resolves "molecular signatures" characteristic to focal-adhesions and related structures, as well as sub-domains within these adhesion sites. This analysis enhances the spatial information with additional "contents-resolved" dimensions. We propose that compositional imaging can serve as a powerful tool for studying complex multi-molecular assemblies in cells and for mapping their distribution at sub-micron resolution.


Conflict of interest statement

Competing Interests: The authors have declared that no competing interests exist.

Figures

Figure 1
Figure 1. Images of REF52 cells labeled for four sets of five focal-adhesion-associated components.
REF52 cells, stably expressing β3-integrin-GFP, were fixed 24 hours after plating and labeled for actin and paxillin, as well as for: (A) vinculin and α-actinin, (B) zyxin and α-actinin, (C) FAK and α-actinin, (D) vinculin and phosphotyrosine (PY). (A') REF52 cells treated for 3 hours with 100 µM of the Rho-kinase inhibitor Y-27632 and labeled as in (A). The fluorophores used here include: Cy5 (for the IR1 channel), Alexa-750 (IR2), Cy3 or Alexa-555 (red), GFP (green) and CPITC (blue). Images were acquired using selective excitation and emission filter sets for five fluorescent channels. Scale bar, 10 µm.
Figure 2
Figure 2. Identifying compositional signatures of adhesion sites by cluster analysis.
REF52 cells were subjected to: no treatment, Y-27632, and Y-27632 with a subsequent recovery period of 3, 15 or 60 minutes. The cells were then fixed, labeled for vinculin, paxillin, α-actinin and actin, and their 5-color images (including β3-integrin-GFP) were analyzed. For each of the 5 treatments 4 cells were sampled, creating a pool of 20 cells. (A) Images showing a single non-treated, 5-color-labeled, cell in all 10 possible combinations of 2 components superposition images. Scale bar, 10 µm. (B) A matrix presenting the composition of all pixels above background in the 20 multicolor images (original). Color indicates the fractional intensity of a given component in each given pixel. The rows were then reordered according to the top-down clustering algorithm based on compositional similarity (clustered). The process was deliberately designed to over-divide the data into 32 clusters. (C) Bottom-up merging of the over-divided clusters. The dendrogram presents the hierarchical distance between the merged clusters during the merging process. The significance of each cluster along the merging process (i.e. each node in the dendrogram) was further evaluated visually, based on the spatial coherence of the sub-cellular distribution of its pixels. Thus, the initial 32 clusters were merged to 10 final ones, which define compositional signatures, and were assigned distinguishable colors for visualizing their sub-cellular distribution.
Figure 3
Figure 3. Five-component compositional signatures of cell-matrix adhesions and stress-fibers.
The process for defining compositional signatures, as shown in Figure 2, was performed for four labeling sets (A–D) of five components each (see Fig. 1 legend). Right, bar-plots presenting the average intensity for each component in each cluster, defining the compositional signatures. These intensities are scaled, but not normalized to one-unit composition vector (Vs, see Materials and Methods section), to allow comparison of actual labeling intensities between signatures. Clusters from different labeling sets, which have similar composition for the shared components, were given the same number and color. The asterisk symbol indicates clusters that were later defined as noise based on their spatial distribution in the cells. The standard deviations were calculated as described in the text. Left, scatter-plots presenting, for each labeling set, the fractional intensity of 2 components (out of 5-components composition) in each pixel, for all possible 2-from-5 combinations. Each dot in the scatter-plots corresponds to a pixel, colored according to the cluster it is assigned to. Due to the normalization to one-unit composition vector (see Materials and Methods section), at each two-components projection the pixels cannot span more than a quarter-circle with a radius of one, but can be at smaller radiuses due to the other 3 components excluded from the projection.
Figure 4
Figure 4. Sub-cellular localization of the compositional clusters in non-treated and treated REF52 cells.
Images of the 5-components-labeled cells, in which each pixel is colored according to its cluster assignment (the color-code is indicated on the right, and is consistent with Fig. 3). The rows correspond to the four labeling sets (A–D), as shown in Figure 3. The columns correspond to treatments (non-treated, Y-27632 treatment, and Y-27632 treatment with a subsequent recovery period of 3, 15 and 60 minutes). Scale bar, 10 µm.
Figure 5
Figure 5. The effect of Rho-kinase inhibition and recovery on the abundance of compositional signatures.
(A) The number of pixels assigned to each signature was counted in non-treated cells and in cells treated with Y-27632 (based on Fig. 4 and Supplementary Figs. S1, S2, S3 and S4). The response of each signature to Y-27632 was then defined as: Log(number of pixels in Y-27632 treated cells/number of pixels in non-treated cells). Thus, positive values indicate increase in abundance, negative values indicate decrease and zero indicates no change, in response to Y-27632. Crosses exclude letter-number combinations that do not correspond to a defined signature (according to Fig. 3), or that correspond to signatures defined as noise (see Fig. 3) or signatures absent in non-treated cells (see Table 2). (B) Changes in the abundance of compositional signatures in response to Rho-kinase inhibition and following its recovery. Each position of each signature in the scatter plot is determined by its response to the Y-27632 treatment (horizontal axis) and to the recovery treatment (vertical axis). The response to Y-27632 was calculated as described for (A). The response to recovery was calculated as Log(number of pixels after recovery of 60 minutes/number of pixels in Y-27632 treated cells). The signatures are marked with a letter A–D, indicating the particular labeling set, and a color indicating its number, consistently with Figure 3. The diagonal dashed line marks the expected trend if the response to Y-27632 and the recovery were exactly opposite processes.

Similar articles

Cited by

References

    1. Irish JM, Hovland R, Krutzik PO, Perez OD, Bruserud O, et al. Single Cell Profiling of Potentiated Phospho-Protein Networks in Cancer Cells. Cell. 2004;118:217–228. - PubMed
    1. De Rosa SC, Herzenberg LA, Roederer M. 11-color, 13-parameter flow cytometry: identification of human naive T cells by phenotype, function, and T-cell receptor diversity. Nat Med. 2001;7:245–248. - PubMed
    1. Mallick P, Schirle M, Chen SS, Flory MR, Lee H, et al. Computational prediction of proteotypic peptides for quantitative proteomics. Nat Biotechnol. 2007;25:125–131. - PubMed
    1. Gygi SP, Rist B, Gerber SA, Turecek F, Gelb MH, et al. Quantitative analysis of complex protein mixtures using isotope-coded affinity tags. Nat Biotechnol. 1999;17:994–999. - PubMed
    1. Rhodes DR, Chinnaiyan AM. Integrative analysis of the cancer transcriptome. Nat Genet 37 Suppl. 2005:S31–37. - PubMed

Publication types

Substances