

Gene expression signatures of radiation response are specific, durable and accurate in mice and humans
- PMID: 18382685
- PMCID: PMC2271127
- DOI: 10.1371/journal.pone.0001912
Gene expression signatures of radiation response are specific, durable and accurate in mice and humans
Erratum in
- PLoS ONE. 2008;3(5). doi: 10.1371/annotation/83c37842-8867-4cfb-a271-9e4bf36fb9b8. Ginsburg, Geoff [corrected to Ginsburg, Geoffrey S]
Abstract
Background: Previous work has demonstrated the potential for peripheral blood (PB) gene expression profiling for the detection of disease or environmental exposures.
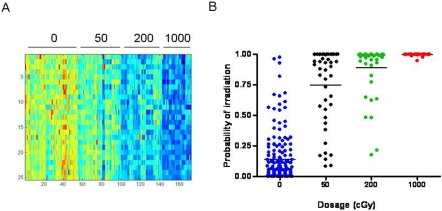
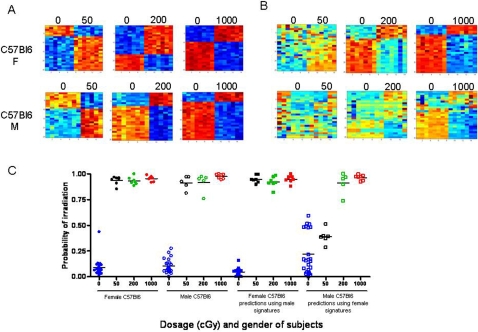
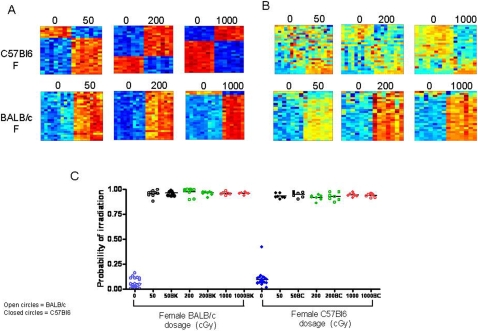
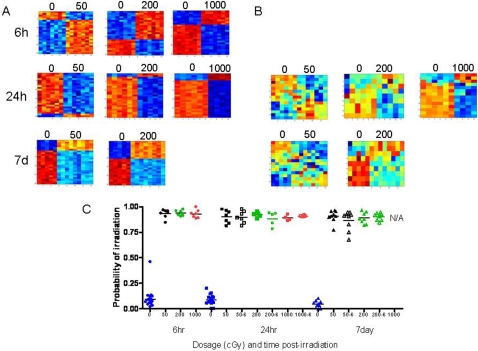
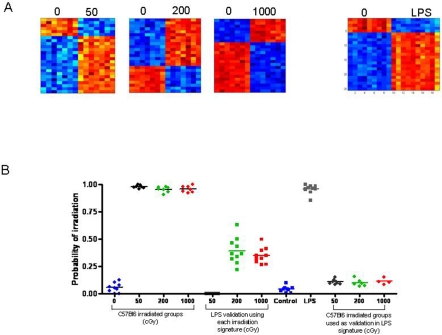
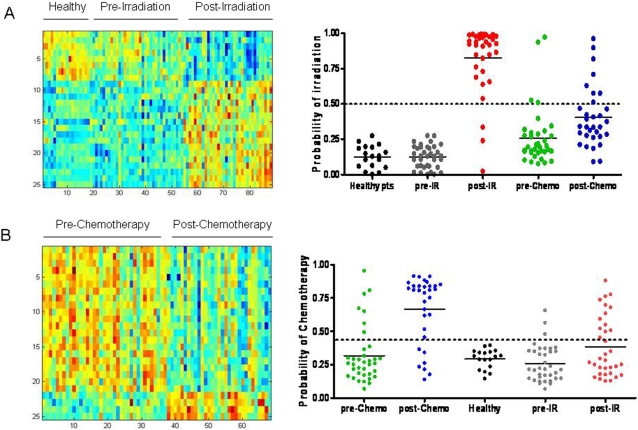
Methods and findings: We have sought to determine the impact of several variables on the PB gene expression profile of an environmental exposure, ionizing radiation, and to determine the specificity of the PB signature of radiation versus other genotoxic stresses. Neither genotype differences nor the time of PB sampling caused any lessening of the accuracy of PB signatures to predict radiation exposure, but sex difference did influence the accuracy of the prediction of radiation exposure at the lowest level (50 cGy). A PB signature of sepsis was also generated and both the PB signature of radiation and the PB signature of sepsis were found to be 100% specific at distinguishing irradiated from septic animals. We also identified human PB signatures of radiation exposure and chemotherapy treatment which distinguished irradiated patients and chemotherapy-treated individuals within a heterogeneous population with accuracies of 90% and 81%, respectively.
Conclusions: We conclude that PB gene expression profiles can be identified in mice and humans that are accurate in predicting medical conditions, are specific to each condition and remain highly accurate over time.
Conflict of interest statement
Figures
Similar articles
-
Gene expression signatures that predict radiation exposure in mice and humans.PLoS Med. 2007 Apr;4(4):e106. doi: 10.1371/journal.pmed.0040106. PLoS Med. 2007. PMID: 17407386 Free PMC article.
-
Diagnosis of partial body radiation exposure in mice using peripheral blood gene expression profiles.PLoS One. 2010 Jul 12;5(7):e11535. doi: 10.1371/journal.pone.0011535. PLoS One. 2010. PMID: 20634956 Free PMC article.
-
A translatable predictor of human radiation exposure.PLoS One. 2014 Sep 25;9(9):e107897. doi: 10.1371/journal.pone.0107897. eCollection 2014. PLoS One. 2014. PMID: 25255453 Free PMC article.
-
Peripheral blood signatures of lead exposure.PLoS One. 2011;6(8):e23043. doi: 10.1371/journal.pone.0023043. Epub 2011 Aug 1. PLoS One. 2011. PMID: 21829687 Free PMC article.
-
Gene expression profiles for monitoring radiation exposure.Radiat Prot Dosimetry. 2001;97(1):11-6. doi: 10.1093/oxfordjournals.rpd.a006632. Radiat Prot Dosimetry. 2001. PMID: 11763352 Review.
Cited by
-
Transcriptomics for radiation biodosimetry: progress and challenges.Int J Radiat Biol. 2023;99(6):925-933. doi: 10.1080/09553002.2021.1928784. Epub 2021 May 21. Int J Radiat Biol. 2023. PMID: 33970766 Free PMC article. Review.
-
Integrative network analyses of transcriptomics data reveal potential drug targets for acute radiation syndrome.Sci Rep. 2021 Mar 10;11(1):5585. doi: 10.1038/s41598-021-85044-5. Sci Rep. 2021. PMID: 33692493 Free PMC article.
-
Radiation-induced alternative transcription and splicing events and their applicability to practical biodosimetry.Sci Rep. 2016 Jan 14;6:19251. doi: 10.1038/srep19251. Sci Rep. 2016. PMID: 26763932 Free PMC article.
-
DNA repair and cell cycle biomarkers of radiation exposure and inflammation stress in human blood.PLoS One. 2012;7(11):e48619. doi: 10.1371/journal.pone.0048619. Epub 2012 Nov 7. PLoS One. 2012. PMID: 23144912 Free PMC article.
-
Gene and protein analysis reveals that p53 pathway is functionally inactivated in cytogenetically normal Acute Myeloid Leukemia and Acute Promyelocytic Leukemia.BMC Med Genomics. 2017 Mar 24;10(1):18. doi: 10.1186/s12920-017-0249-2. BMC Med Genomics. 2017. PMID: 28340577 Free PMC article.
References
-
- Boolchand V, Olds G, Singh J, Singh P, Chak A, Cooper G. Colorectal screening after polypectomy: a national survey study of primary care physicians. Ann Intern Med. 2006;145:654–659. - PubMed
-
- Mandel M, Achiron A. Gene expression studies in systemic lupus erythematosus. Lupus. 2006;15:451–456. - PubMed
Publication types
MeSH terms
Substances
Grants and funding
LinkOut - more resources
Full Text Sources
Other Literature Sources
Molecular Biology Databases
