

Maternal cocaine administration in mice alters DNA methylation and gene expression in hippocampal neurons of neonatal and prepubertal offspring
- PMID: 18382688
- PMCID: PMC2271055
- DOI: 10.1371/journal.pone.0001919
Maternal cocaine administration in mice alters DNA methylation and gene expression in hippocampal neurons of neonatal and prepubertal offspring
Abstract
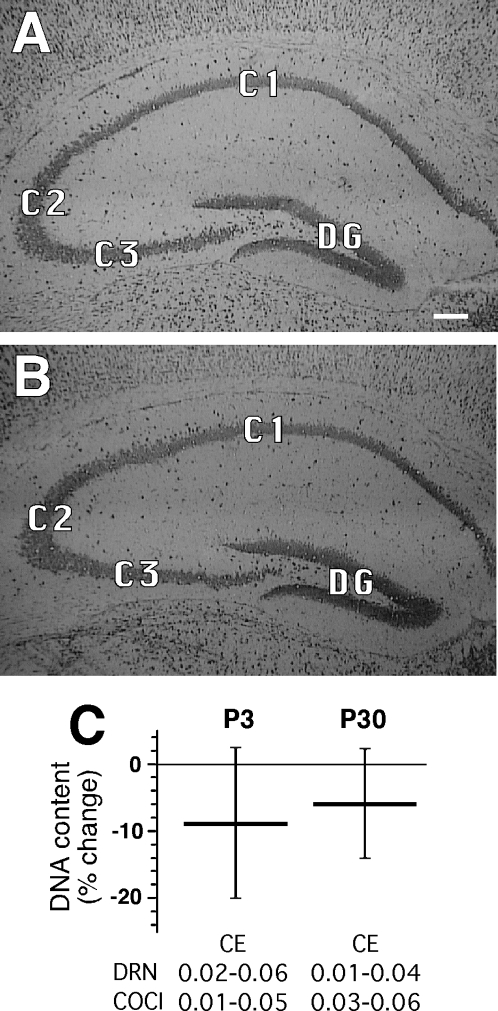
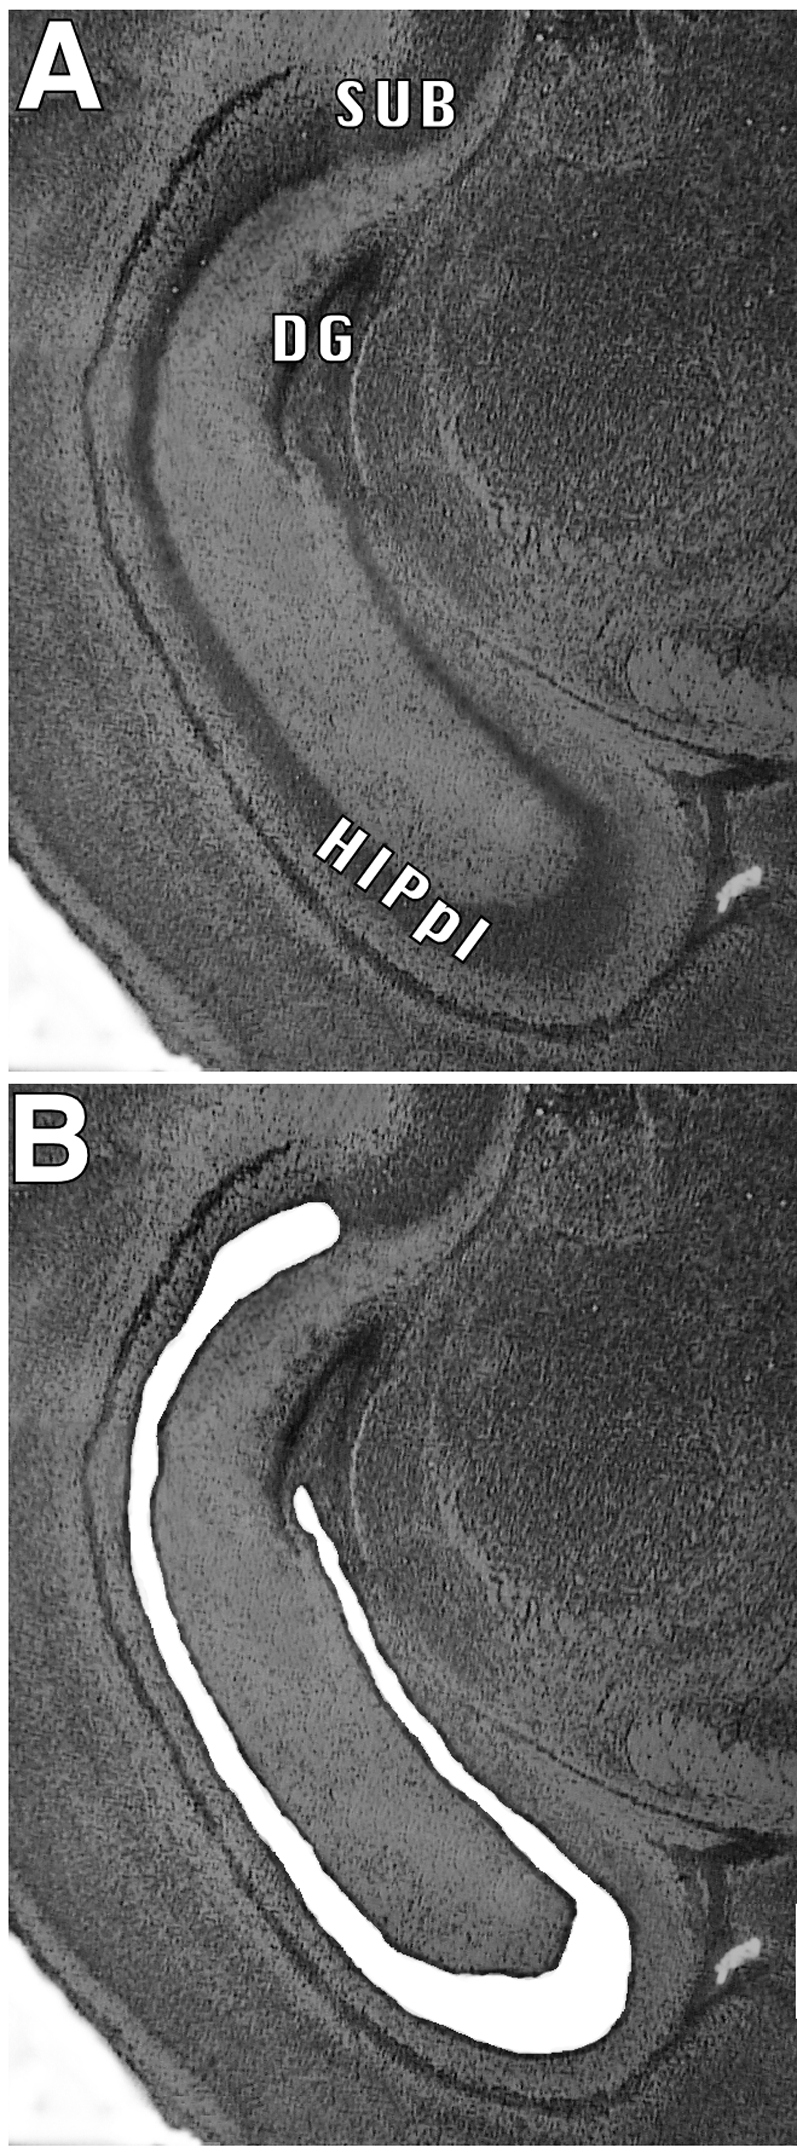
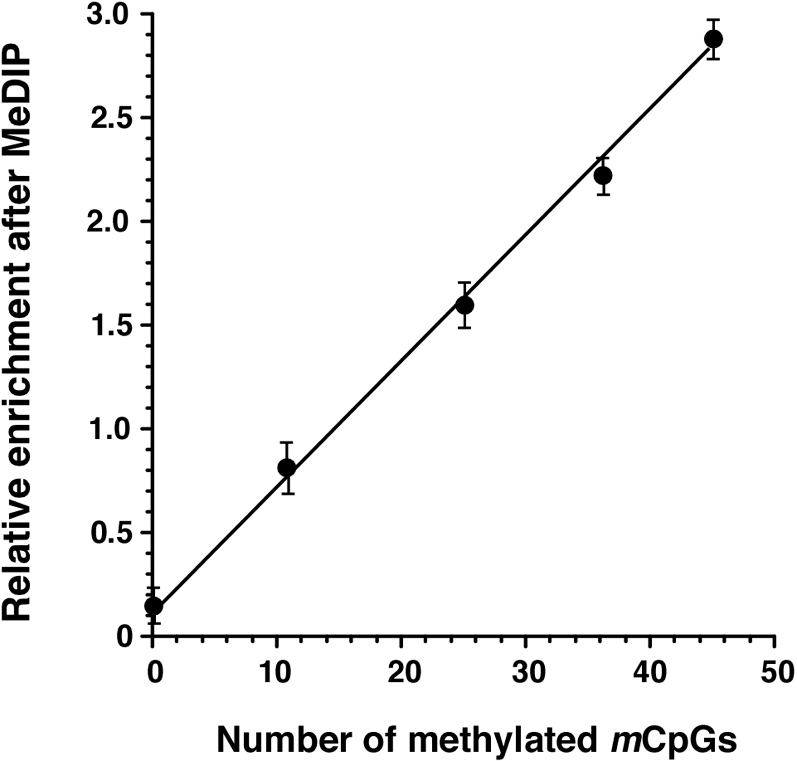
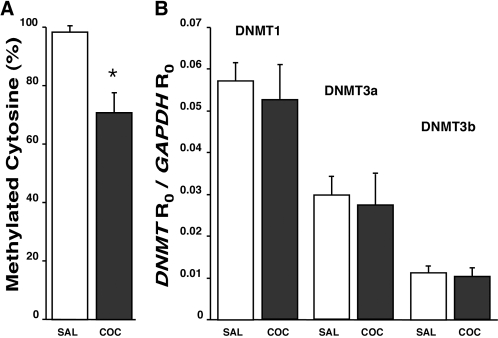
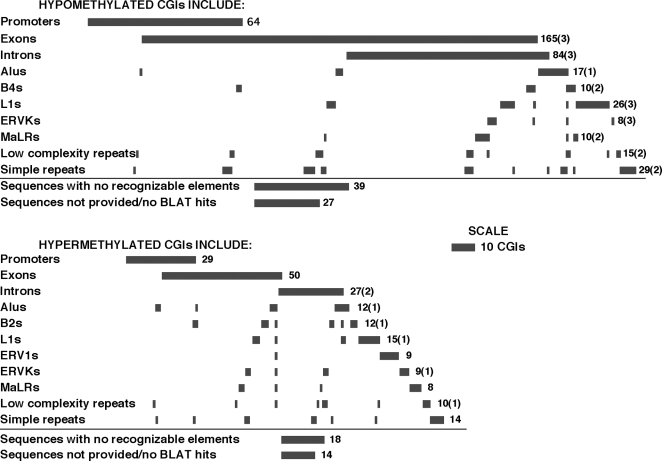
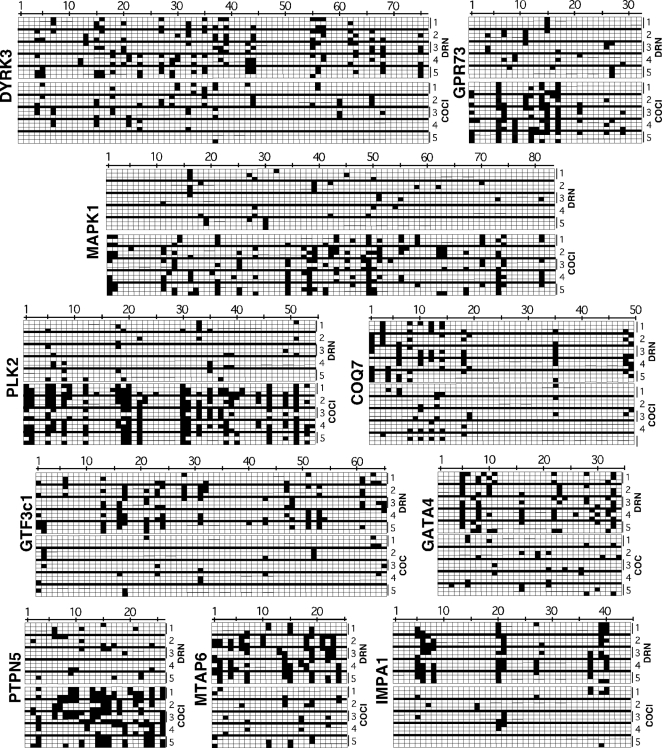
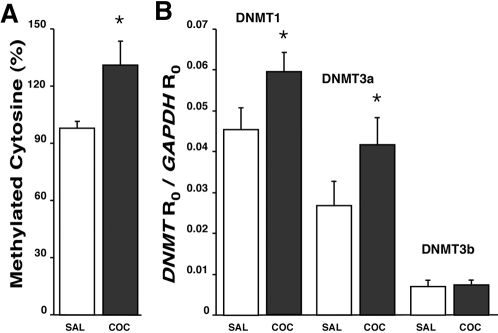
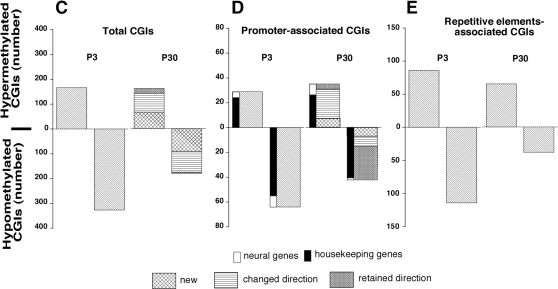
Previous studies documented significant behavioral changes in the offspring of cocaine-exposed mothers. We now explore the hypothesis that maternal cocaine exposure could alter the fetal epigenetic machinery sufficiently to cause lasting neurochemical and functional changes in the offspring. Pregnant CD1 mice were administered either saline or 20 mg/kg cocaine twice daily on gestational days 8-19. Male pups from each of ten litters of the cocaine and control groups were analyzed at 3 (P3) or 30 (P30) days postnatum. Global DNA methylation, methylated DNA immunoprecipitation followed by CGI(2) microarray profiling and bisulfite sequencing, as well as quantitative real-time RT-PCR gene expression analysis, were evaluated in hippocampal pyramidal neurons excised by laser capture microdissection. Following maternal cocaine exposure, global DNA methylation was significantly decreased at P3 and increased at P30. Among the 492 CGIs whose methylation was significantly altered by cocaine at P3, 34% were hypermethylated while 66% were hypomethylated. Several of these CGIs contained promoter regions for genes implicated in crucial cellular functions. Endogenous expression of selected genes linked to the abnormally methylated CGIs was correspondingly decreased or increased by as much as 4-19-fold. By P30, some of the cocaine-associated effects at P3 endured, reversed to opposite directions, or disappeared. Further, additional sets of abnormally methylated targets emerged at P30 that were not observed at P3. Taken together, these observations indicate that maternal cocaine exposure during the second and third trimesters of gestation could produce potentially profound structural and functional modifications in the epigenomic programs of neonatal and prepubertal mice.
Conflict of interest statement
Figures
Similar articles
-
In utero exposure to maternal smoking is associated with DNA methylation alterations and reduced neuronal content in the developing fetal brain.Epigenetics Chromatin. 2017 Jan 26;10:4. doi: 10.1186/s13072-017-0111-y. eCollection 2017. Epigenetics Chromatin. 2017. PMID: 28149327 Free PMC article.
-
Maternal cocaine administration causes an epigenetic modification of protein kinase Cepsilon gene expression in fetal rat heart.Mol Pharmacol. 2007 May;71(5):1319-28. doi: 10.1124/mol.106.032011. Epub 2007 Jan 3. Mol Pharmacol. 2007. PMID: 17202284
-
Low-dose Cd induces hepatic gene hypermethylation, along with the persistent reduction of cell death and increase of cell proliferation in rats and mice.PLoS One. 2012;7(3):e33853. doi: 10.1371/journal.pone.0033853. Epub 2012 Mar 23. PLoS One. 2012. PMID: 22457795 Free PMC article.
-
Fetal exposure to cocaine causes programming of Prkce gene repression in the left ventricle of adult rat offspring.Biol Reprod. 2009 Mar;80(3):440-8. doi: 10.1095/biolreprod.108.072983. Epub 2008 Oct 22. Biol Reprod. 2009. PMID: 18945988 Free PMC article.
-
[Exploration of Epigenetic Changes and DNA Methylation Markers Associated with Liver Tumors Induced by Inorganic Arsenite Exposure in Mice].Nihon Eiseigaku Zasshi. 2015;70(3):181-5. doi: 10.1265/jjh.70.181. Nihon Eiseigaku Zasshi. 2015. PMID: 26411935 Review. Japanese.
Cited by
-
The MTHFR C677T Variant is Associated with Responsiveness to Disulfiram Treatment for Cocaine Dependency.Front Psychiatry. 2013 Jan 14;3:109. doi: 10.3389/fpsyt.2012.00109. eCollection 2012. Front Psychiatry. 2013. PMID: 23335901 Free PMC article.
-
The Epigenetic Link between Prenatal Adverse Environments and Neurodevelopmental Disorders.Genes (Basel). 2017 Mar 18;8(3):104. doi: 10.3390/genes8030104. Genes (Basel). 2017. PMID: 28335457 Free PMC article. Review.
-
Search for genetic markers and functional variants involved in the development of opiate and cocaine addiction and treatment.Ann N Y Acad Sci. 2010 Feb;1187:184-207. doi: 10.1111/j.1749-6632.2009.05275.x. Ann N Y Acad Sci. 2010. PMID: 20201854 Free PMC article. Review.
-
Transgenerational effects of alcohol on behavioral sensitivity to alcohol in Caenorhabditis elegans.PLoS One. 2022 Oct 18;17(10):e0271849. doi: 10.1371/journal.pone.0271849. eCollection 2022. PLoS One. 2022. PMID: 36256641 Free PMC article.
-
Ethanol induced acetylation of histone at G9a exon1 and G9a-mediated histone H3 dimethylation leads to neurodegeneration in neonatal mice.Neuroscience. 2014 Jan 31;258:422-32. doi: 10.1016/j.neuroscience.2013.11.043. Epub 2013 Dec 1. Neuroscience. 2014. PMID: 24300108 Free PMC article.
References
-
- Paoloni-Giacobino A, Chaillet JR. The role of DMDs in the maintenance of epigenetic states. Cytogenet Genome Res. 2006;113:116–121. - PubMed
-
- Beck S, Olek A. Berlin: Wiley Verlag; 2003. The Epigenome: Molecular Hide and Seek. p. 188.
-
- Jones PA, Takai D. The role of DNA methylation in mammalian epigenetics. Science. 2001;293:1068–1070. - PubMed
-
- Bird A. DNA methylation patterns and epigenetic memory. Genes Dev. 2002;16:6–21. - PubMed
Publication types
MeSH terms
Substances
Grants and funding
LinkOut - more resources
Full Text Sources
Medical
Molecular Biology Databases
