

Pharmacogenomics of interferon-beta therapy in multiple sclerosis: baseline IFN signature determines pharmacological differences between patients
- PMID: 18382694
- PMCID: PMC2271130
- DOI: 10.1371/journal.pone.0001927
Pharmacogenomics of interferon-beta therapy in multiple sclerosis: baseline IFN signature determines pharmacological differences between patients
Abstract
Background: Multiple sclerosis (MS) is a heterogeneous disease. In order to understand the partial responsiveness to IFNbeta in Relapsing Remitting MS (RRMS) we studied the pharmacological effects of IFNbeta therapy.
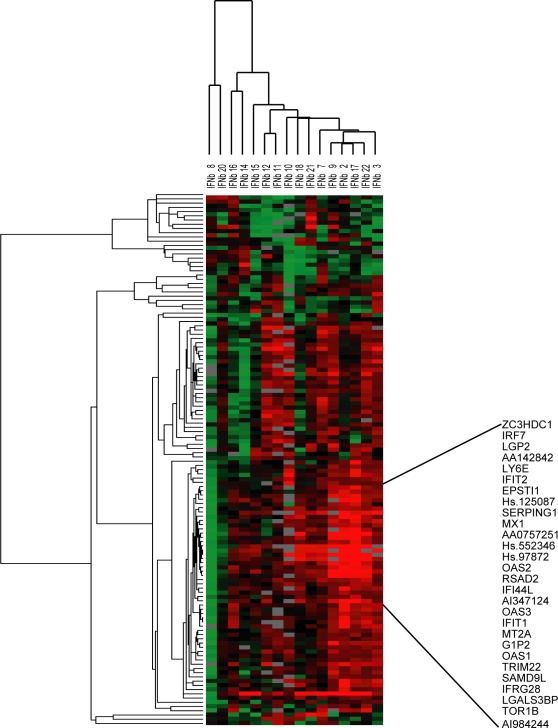
Methodology: Large scale gene expression profiling was performed on peripheral blood of 16 RRMS patients at baseline and one month after the start of IFNbeta therapy. Differential gene expression was analyzed by Significance Analysis of Microarrays. Subsequent expression analyses on specific genes were performed after three and six months of treatment. Peripheral blood mononuclear cells (PBMC) were isolated and stimulated in vitro with IFNbeta. Genes of interest were measured and validated by quantitative realtime PCR. An independent group of 30 RRMS patients was used for validation.
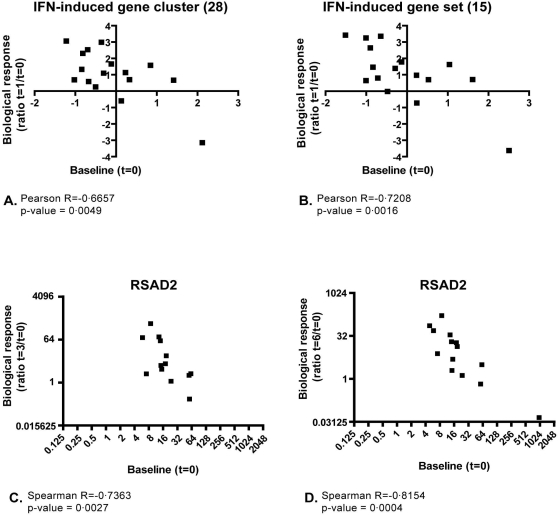
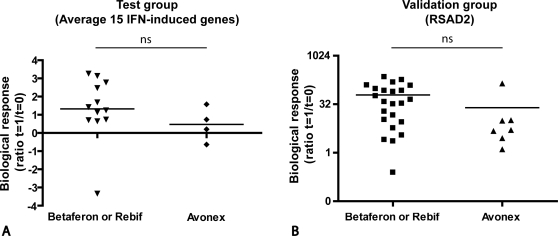
Principal findings: Pharmacogenomics revealed a marked variation in the pharmacological response to IFNbeta between patients. A total of 126 genes were upregulated in a subset of patients whereas in other patients these genes were downregulated or unchanged after one month of IFNbeta therapy. Most interestingly, we observed that the extent of the pharmacological response correlates negatively with the baseline expression of a specific set of 15 IFN response genes (R = -0.7208; p = 0.0016). The negative correlation was maintained after three (R = -0.7363; p = 0.0027) and six (R = -0.8154; p = 0.0004) months of treatment, as determined by gene expression levels of the most significant correlating gene. Similar results were obtained in an independent group of patients (n = 30; R = -0.4719; p = 0.0085). Moreover, the ex vivo results could be confirmed by in vitro stimulation of purified PBMCs at baseline with IFNbeta indicating that differential responsiveness to IFNbeta is an intrinsic feature of peripheral blood cells at baseline.
Conclusion: These data imply that the expression levels of IFN response genes in the peripheral blood of MS patients prior to treatment could serve a role as biomarker for the differential clinical response to IFNbeta.
Conflict of interest statement
Figures
Similar articles
-
IFN-beta1b induces transient and variable gene expression in relapsing-remitting multiple sclerosis patients independent of neutralizing antibodies or changes in IFN receptor RNA expression.J Interferon Cytokine Res. 2008 May;28(5):317-31. doi: 10.1089/jir.2007.0131. J Interferon Cytokine Res. 2008. PMID: 18547162
-
Interferon regulatory factor 5 gene variants and pharmacological and clinical outcome of Interferonβ therapy in multiple sclerosis.Genes Immun. 2011 Sep;12(6):466-72. doi: 10.1038/gene.2011.18. Epub 2011 Apr 7. Genes Immun. 2011. PMID: 21471993
-
Aligned Expression of IFI16 and STING Genes in RRMS Patients' Blood.Endocr Metab Immune Disord Drug Targets. 2020;20(6):878-886. doi: 10.2174/1871530319666190729112246. Endocr Metab Immune Disord Drug Targets. 2020. PMID: 31362682
-
Effect of genetic polymorphisms on therapeutic response in multiple sclerosis relapsing-remitting patients treated with interferon-beta.Mutat Res Rev Mutat Res. 2020 Jul-Sep;785:108322. doi: 10.1016/j.mrrev.2020.108322. Epub 2020 Jul 7. Mutat Res Rev Mutat Res. 2020. PMID: 32800273 Review.
-
An inventory of short term and long term changes in gene expression under interferon β treatment of relapsing remitting MS patients.Curr Pharm Des. 2012;18(29):4475-84. doi: 10.2174/138161212802502215. Curr Pharm Des. 2012. PMID: 22612748 Review.
Cited by
-
Interferon-beta induces distinct gene expression response patterns in human monocytes versus T cells.PLoS One. 2013 Apr 23;8(4):e62366. doi: 10.1371/journal.pone.0062366. Print 2013. PLoS One. 2013. PMID: 23626809 Free PMC article.
-
Feasibility of the use of combinatorial chemokine arrays to study blood and CSF in multiple sclerosis.PLoS One. 2013 Nov 20;8(11):e81007. doi: 10.1371/journal.pone.0081007. eCollection 2013. PLoS One. 2013. PMID: 24278364 Free PMC article.
-
Interferon-beta-1b-induced short- and long-term signatures of treatment activity in multiple sclerosis.Pharmacogenomics J. 2013 Oct;13(5):443-51. doi: 10.1038/tpj.2012.27. Epub 2012 Jun 19. Pharmacogenomics J. 2013. PMID: 22711062 Free PMC article.
-
Pro-Inflammatory Signaling by IL-10 and IL-22: Bad Habit Stirred Up by Interferons?Front Immunol. 2013 Feb 4;4:18. doi: 10.3389/fimmu.2013.00018. eCollection 2013. Front Immunol. 2013. PMID: 23382730 Free PMC article.
-
Assessing the human immune system through blood transcriptomics.BMC Biol. 2010 Jul 1;8:84. doi: 10.1186/1741-7007-8-84. BMC Biol. 2010. PMID: 20619006 Free PMC article. Review.
References
-
- Hafler DA, Slavik JM, Anderson DE, O'Connor KC, De JP, et al. Multiple sclerosis. Immunol Rev. 2005;204:208–231. - PubMed
-
- The IFNB Multiple Sclerosis Study Group and The University of British Columbia MS/MRI Analysis Group. Interferon beta-1b in the treatment of multiple sclerosis: final outcome of the randomized controlled trial. Neurology. 1995;45:1277–1285. - PubMed
-
- Rudick RA, Lee JC, Simon J, Ransohoff RM, Fisher E. Defining interferon beta response status in multiple sclerosis patients. Ann Neurol. 2004;56:548–555. - PubMed
-
- Reske D, Walser A, Haupt WF, Petereit HF. Long-term persisting interferon beta-1b neutralizing antibodies after discontinuation of treatment. Acta Neurol Scand. 2004;109:66–70. - PubMed
-
- Rice GP, Paszner B, Oger J, Lesaux J, Paty D, et al. The evolution of neutralizing antibodies in multiple sclerosis patients treated with interferon beta-1b. Neurology. 1999;52:1277–1279. - PubMed
Publication types
MeSH terms
Substances
LinkOut - more resources
Full Text Sources
Other Literature Sources
Molecular Biology Databases
