

Relationship between choline and apparent diffusion coefficient in patients with gliomas
- PMID: 18383265
- PMCID: PMC3030277
- DOI: 10.1002/jmri.21288
Relationship between choline and apparent diffusion coefficient in patients with gliomas
Abstract
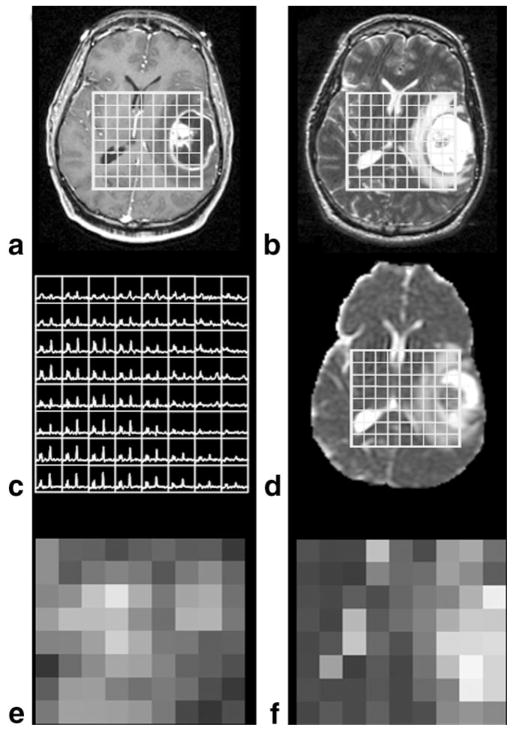
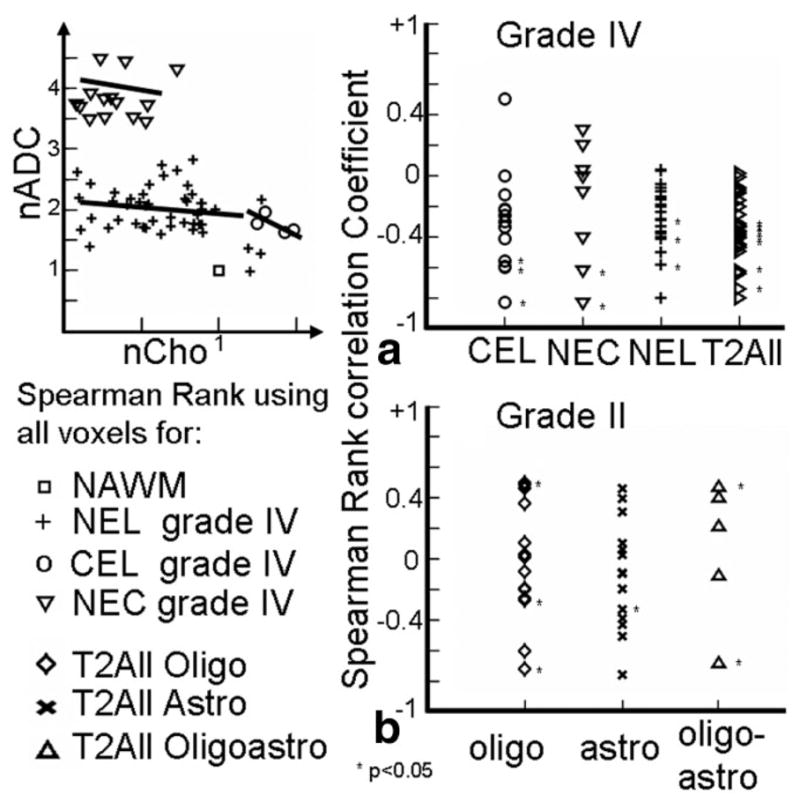
Purpose: To examine the relationship between apparent diffusion coefficients (ADC) from diffusion weighted imaging (DWI) and choline levels from proton magnetic resonance spectroscopic imaging (MRSI) in newly diagnosed Grade II and IV gliomas within distinct anatomic regions.
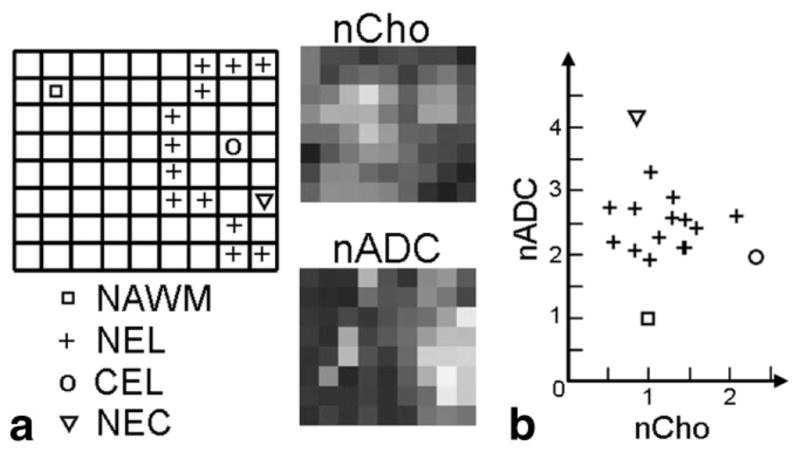
Materials and methods: A total of 37 patients with Grade II and 28 patients with Grade IV glioma were scanned on a 1.5T system with 3D MRSI and DWI. Region level analysis included Spearman rank correlation between median normalized ADC and choline for each patient per grade within each distinct abnormal anatomical region. Voxel level analysis calculated a Spearman rank correlation per region, per patient.
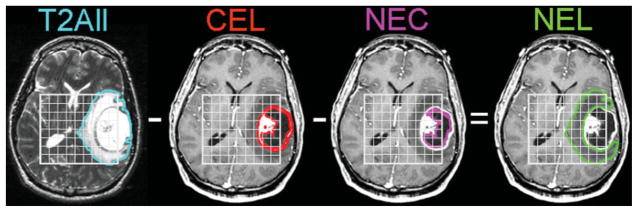
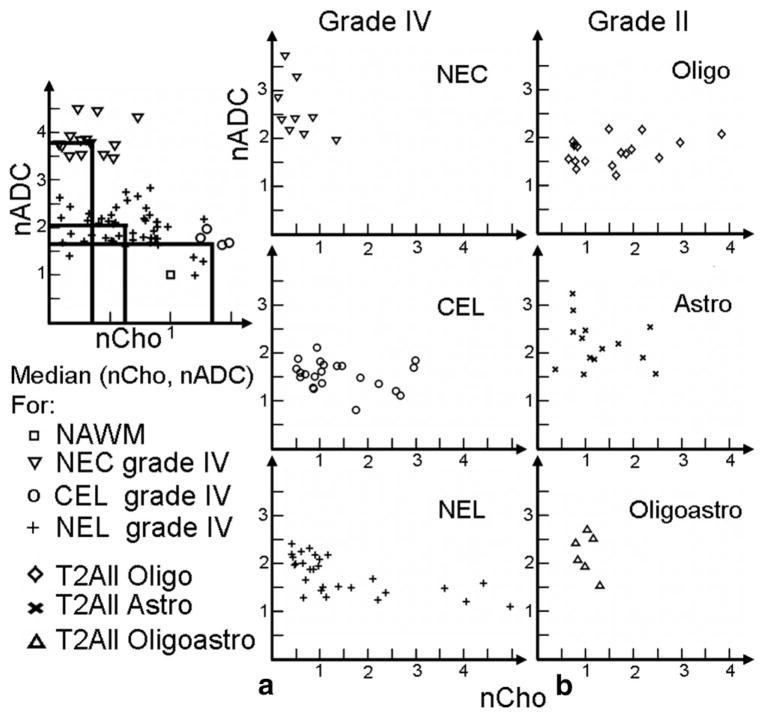
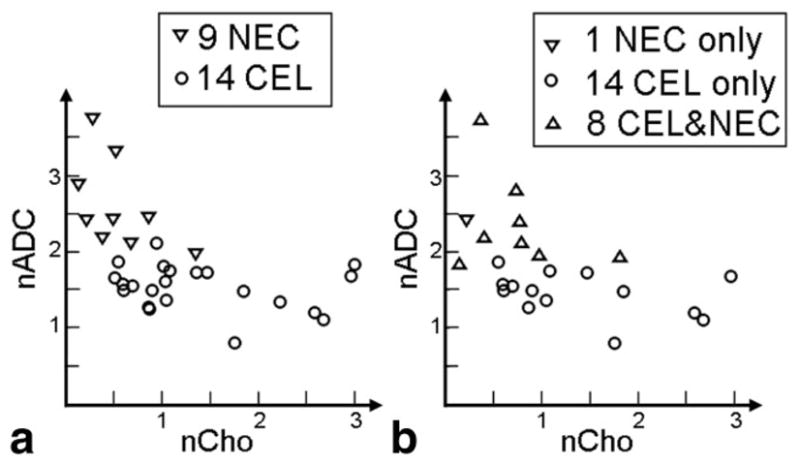
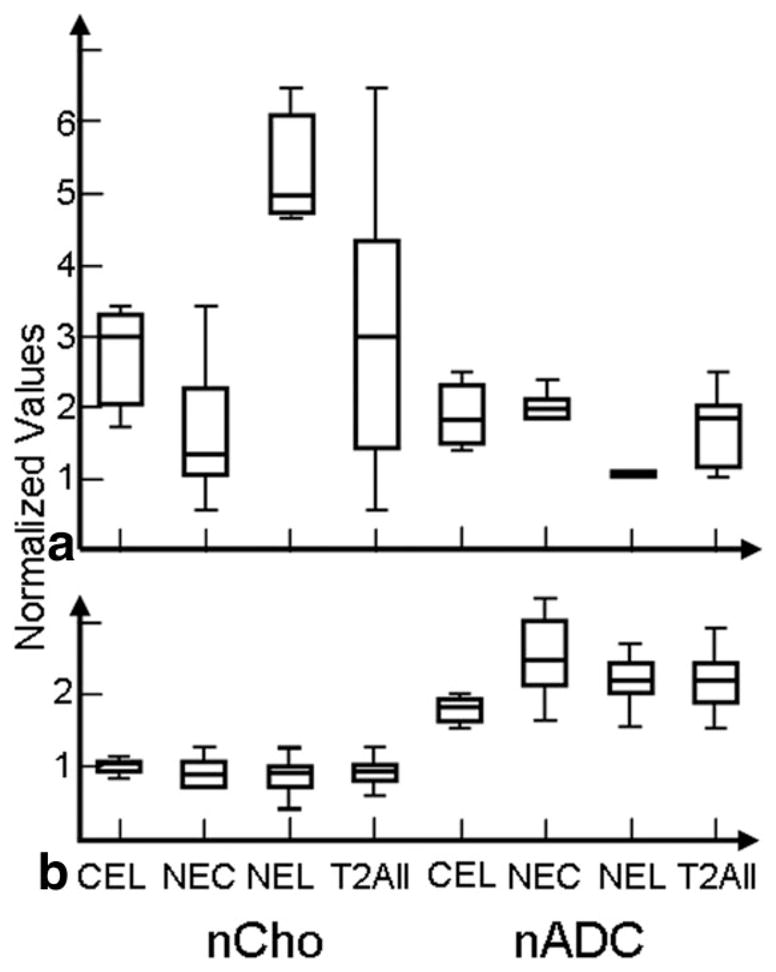
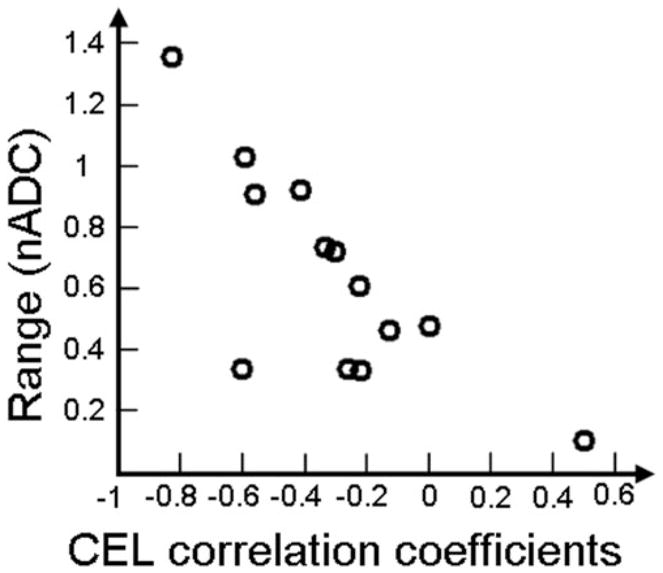
Results: Grade II lesions showed no evidence of a correlation between normalized ADC and choline using either the region or voxel level analysis. Region level analysis of Grade IV lesions did not appear to correlate in the contrast enhancement or necrotic core, but did suggest a significant negative correlation in the more heterogeneous nonenhancing and combined regions.
Conclusion: There appears to be differences in the relationship between ADC and choline levels in Grade II and Grade IV gliomas. Correlation within these regions in Grade IV lesions was strongest when all regions were included, suggesting heterogeneity may be driving the relationship.
(c) 2008 Wiley-Liss, Inc.
Figures
Similar articles
-
Measurements of diagnostic examination performance using quantitative apparent diffusion coefficient and proton MR spectroscopic imaging in the preoperative evaluation of tumor grade in cerebral gliomas.Eur J Radiol. 2011 Nov;80(2):462-70. doi: 10.1016/j.ejrad.2010.07.017. Epub 2010 Aug 13. Eur J Radiol. 2011. PMID: 20708868
-
Multiparametric 3T MR approach to the assessment of cerebral gliomas: tumor extent and malignancy.Neuroradiology. 2006 Sep;48(9):622-31. doi: 10.1007/s00234-006-0102-3. Epub 2006 Jun 3. Neuroradiology. 2006. PMID: 16752135
-
Biopsy targeting gliomas: do functional imaging techniques identify similar target areas?Invest Radiol. 2010 Dec;45(12):755-68. doi: 10.1097/RLI.0b013e3181ec9db0. Invest Radiol. 2010. PMID: 20829706
-
High-grade gliomas and solitary metastases: differentiation by using perfusion and proton spectroscopic MR imaging.Radiology. 2002 Mar;222(3):715-21. doi: 10.1148/radiol.2223010558. Radiology. 2002. PMID: 11867790
-
Characterization of untreated gliomas by magnetic resonance spectroscopic imaging.Neuroimaging Clin N Am. 2002 Nov;12(4):599-613. doi: 10.1016/s1052-5149(02)00037-0. Neuroimaging Clin N Am. 2002. PMID: 12687914 Review.
Cited by
-
Diagnostic performance of apparent diffusion coefficient parameters for glioma grading.J Neurooncol. 2018 Aug;139(1):61-68. doi: 10.1007/s11060-018-2841-5. Epub 2018 Mar 24. J Neurooncol. 2018. PMID: 29574566
-
Integration of preoperative anatomic and metabolic physiologic imaging of newly diagnosed glioma.J Neurooncol. 2009 May;92(3):401-15. doi: 10.1007/s11060-009-9845-0. Epub 2009 Apr 9. J Neurooncol. 2009. PMID: 19357966 Free PMC article.
-
Multiparametric characterization of grade 2 glioma subtypes using magnetic resonance spectroscopic, perfusion, and diffusion imaging.Transl Oncol. 2009 Dec;2(4):271-80. doi: 10.1593/tlo.09178. Transl Oncol. 2009. PMID: 19956389 Free PMC article.
-
Assessing and monitoring intratumor heterogeneity in glioblastoma: how far has multimodal imaging come?CNS Oncol. 2015;4(6):399-410. doi: 10.2217/cns.15.20. Epub 2015 Oct 26. CNS Oncol. 2015. PMID: 26497327 Free PMC article. Review.
-
Quantitative magnetic resonance imaging and radiogenomic biomarkers for glioma characterisation: a systematic review.Br J Radiol. 2018 Dec;91(1092):20170930. doi: 10.1259/bjr.20170930. Epub 2018 Jun 29. Br J Radiol. 2018. PMID: 29902076 Free PMC article.
References
-
- Nelson SJ, McKnight TR, Henry RG. Characterization of untreated gliomas by magnetic resonance spectroscopic imaging. Neuroimaging Clin N Am. 2002;12:599–613. - PubMed
-
- Gupta RK, Cloughesy TF, Sinha U, et al. Relationships between choline magnetic resonance spectroscopy, apparent diffusion coefficient and quantitative histopathology in human glioma. J Neurooncol. 2000;50:215–226. - PubMed
-
- Le Bihan D, Breton E, Lallemand D, Grenier P, Cabanis E, Laval-Jeantet M. MR imaging of intravoxel incoherent motions: application to diffusion and perfusion in neurologic disorders. Radiology. 1986;161:401–407. - PubMed
-
- Sugahara T, Korogi Y, Kochi M, et al. Usefulness of diffusion-weighted MRI with echo-planar technique in the evaluation of cellularity in gliomas. J Magn Reson Imaging. 1999;9:53–60. - PubMed
Publication types
MeSH terms
Substances
Grants and funding
LinkOut - more resources
Full Text Sources
Medical
