

Differentiation between benign and malignant breast lesions detected by bilateral dynamic contrast-enhanced MRI: a sensitivity and specificity study
- PMID: 18383287
- PMCID: PMC3121098
- DOI: 10.1002/mrm.21530
Differentiation between benign and malignant breast lesions detected by bilateral dynamic contrast-enhanced MRI: a sensitivity and specificity study
Abstract
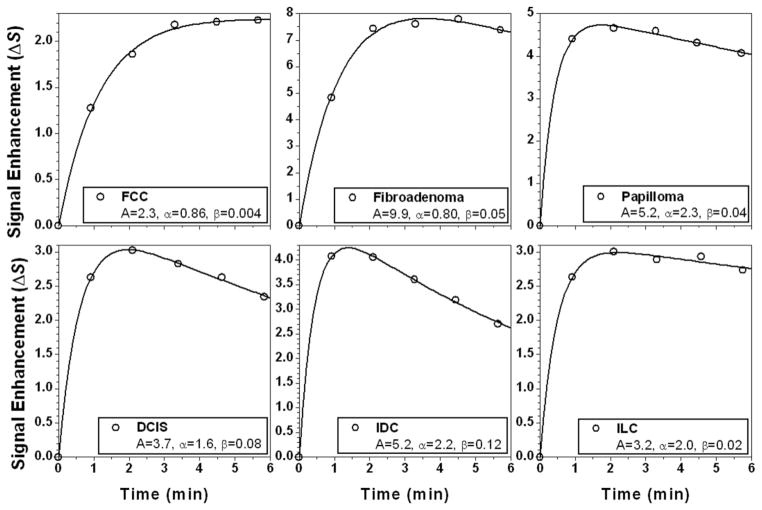
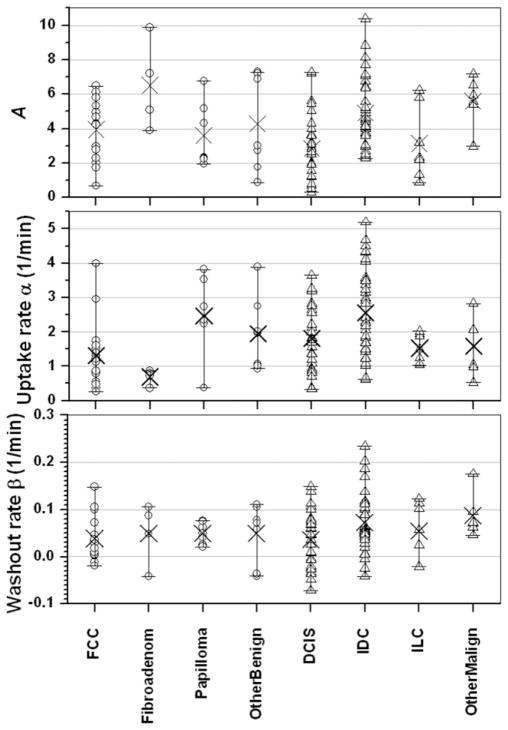
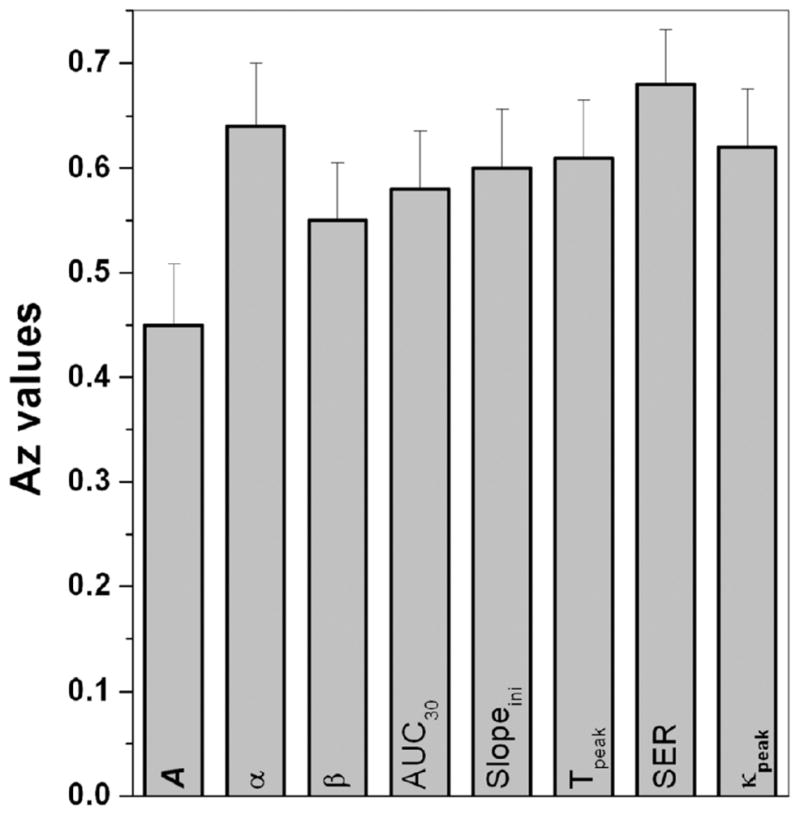
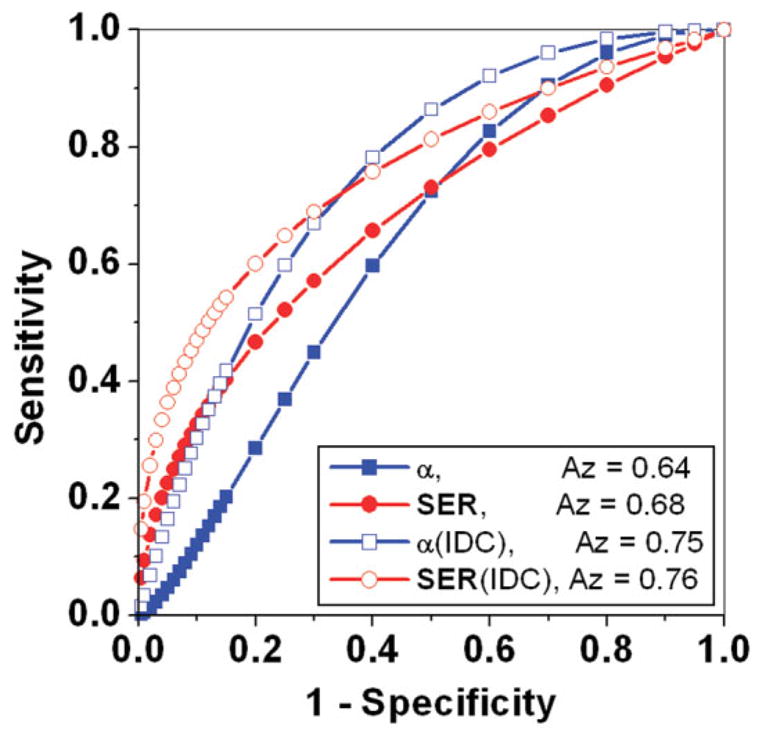
The purpose of this study was to apply an empirical mathematical model (EMM) to kinetic data acquired under a clinical protocol to determine if the sensitivity and specificity can be improved compared with qualitative BI-RADS descriptors of kinetics. 3D DCE-MRI data from 100 patients with 34 benign and 79 malignant lesions were selected for review under an Institutional Review Board (IRB)-approved protocol. The sensitivity and specificity of the delayed phase classification were 91% and 18%, respectively. The EMM was able to accurately fit these curves. There was a statistically significant difference between benign and malignant lesions for several model parameters: the uptake rate, initial slope, signal enhancement ratio, and curvature at the peak enhancement (at most P=0.04). These results demonstrated that EMM analysis provided at least the diagnostic accuracy of the kinetic classifiers described in the BI-RADS lexicon, and offered a few key advantages. It can be used to standardize data from institutions with different dynamic protocols and can provide a more objective classification with continuous variables so that thresholds can be set to achieve desired sensitivity and specificity. This suggests that the EMM may be useful for analysis of routine clinical data.
Figures
References
-
- Tabar L, Dean PB. Mammography and breast cancer: the new era. Int J Gynaecol Obstet. 2003;82:319–326. - PubMed
-
- Abraham DC, Jones RC, Jones SE, Cheek JH, Peters GN, Knox SM, Grant MD, Hampe DW, Savino DA, Harms SE. Evaluation of neoadjuvant chemotherapeutic response of locally advanced breast cancer by magnetic resonance imaging. Cancer. 1996;78:91–100. - PubMed
-
- Boetes C, Mus RD, Holland R, Barentsz JO, Strijk SP, Wobbes T, Hendriks JH, Ruys SH. Breast tumors: comparative accuracy of MR imaging relative to mammography and US for demonstrating extent. Radiology. 1995;197:743–747. - PubMed
-
- Warren RM, Pointon L, Thompson D, Hoff R, Gilbert FJ, Padhani A, Easton D, Lakhani SR, Leach MO. Reading protocol for dynamic contrast-enhanced MR images of the breast: sensitivity and specificity analysis. Radiology. 2005;236:779–788. - PubMed
-
- Heywang-Kobrunner SH, Bick U, Bradley WG, Jr, Bone B, Casselman J, Coulthard A, Fischer U, Muller-Schimpfle M, Oellinger H, Patt R, Teubner J, Friedrich M, Newstead G, Holland R, Schauer A, Sickles EA, Tabar L, Waisman J, Wernecke KD. International investigation of breast MRI: results of a multicentre study (11 sites) concerning diagnostic parameters for contrast-enhanced MRI based on 519 histopathologically correlated lesions. Eur Radiol. 2001;11:531–546. - PubMed
Publication types
MeSH terms
Substances
Grants and funding
LinkOut - more resources
Full Text Sources
Medical
