

Review
doi: 10.1002/dneu.20617.
Using imaging and genetics in zebrafish to study developing spinal circuits in vivo
Affiliations
- PMID: 18383546
- PMCID: PMC3579555
- DOI: 10.1002/dneu.20617
Item in Clipboard
Review
Using imaging and genetics in zebrafish to study developing spinal circuits in vivo
Dev Neurobiol.
2008 May.
Abstract
Imaging and molecular approaches are perfectly suited to young, transparent zebrafish (Danio rerio), where they have allowed novel functional studies of neural circuits and their links to behavior. Here, we review cutting-edge optical and genetic techniques used to dissect neural circuits in vivo and discuss their application to future studies of developing spinal circuits using living zebrafish. We anticipate that these experiments will reveal general principles governing the assembly of neural circuits that control movements.
Figures
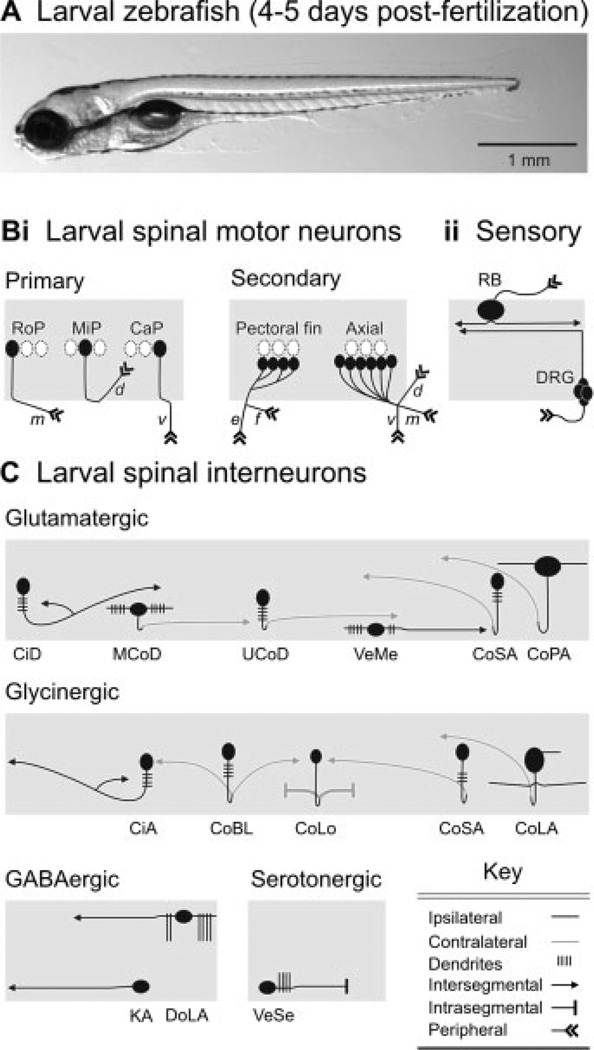
Identified classes of spinal neuron in larval zebrafish. (A) Photograph of a larval zebrafish taken from the side. The head is to the left, in this and subsequent images. (B) Schematic depictions of identified classes of (i) motor neurons and (ii) sensory neurons. Rostral primary (RoP), middle primary (MiP), and caudal primary (CaP) motor neurons are distinctive based on their location with respect to one another and their nonoverlapping regions of axial muscle innervation (m, middle; d, dorsal; v, ventral). Secondary motor neurons can be divided into classes that innervate either the pectoral fins or axial musculature. Rohon-Beard (RB) sensory neurons and dorsal root ganglion (DRG) cells provide the principle source of mechanosensory input to spinal cord. (C) Schematic depictions of identified classes of spinal interneurons, organized according to transmitter phenotype. Abbreviations: CiD, circumferential descending; MCoD, multipolar commissural descending; UCoD, unipolar commissural descending; VeMe, ventral medial; CoSA, commissural secondary ascending; CoPA, commissural primary ascending; CiA, circumferential ascending; CoBL, commissural bifurcating longitudinal; CoLo, commissural local; CoLA, commissural longitudinal ascending; DoLA, dorsal longitudinal ascending; KA, Kolmer-Adhur; VeSe, ventral serotonergic. List compiled from Myers (1985); Bernhardt et al. (1990); Hale et al. (2001); Higashijima et al. (2004); McLean and Fetcho (2004); Thorsen and Hale (2007). See main text for more details.
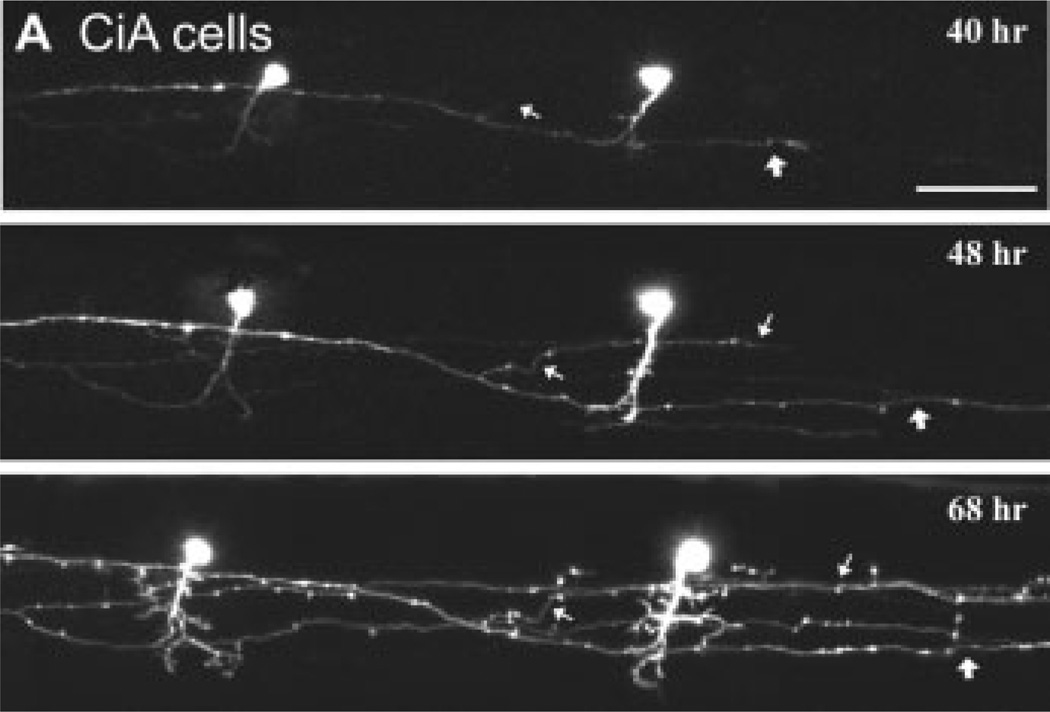
Tracking the development of identified classes of spinal interneuron in vivo. (A) Confocal time lapse imaging of two inhibitory circumferential ascending (CiA) cells stochastically labeled with GFP using En1 as a promoter. CiAs are so named due to their primary ascending axon, however, they also have a secondary descending one. Successive images at different time points (hours postfertilization noted in respective images) illustrate the growth of the descending axon (at thin and thick white arrows), as well as the elaboration of the dendrites. Scale bar is 50 µm. Image reproduced from Higashijima et al. (2004) with permission (Copyright 2004 by the Society for Neuroscience).
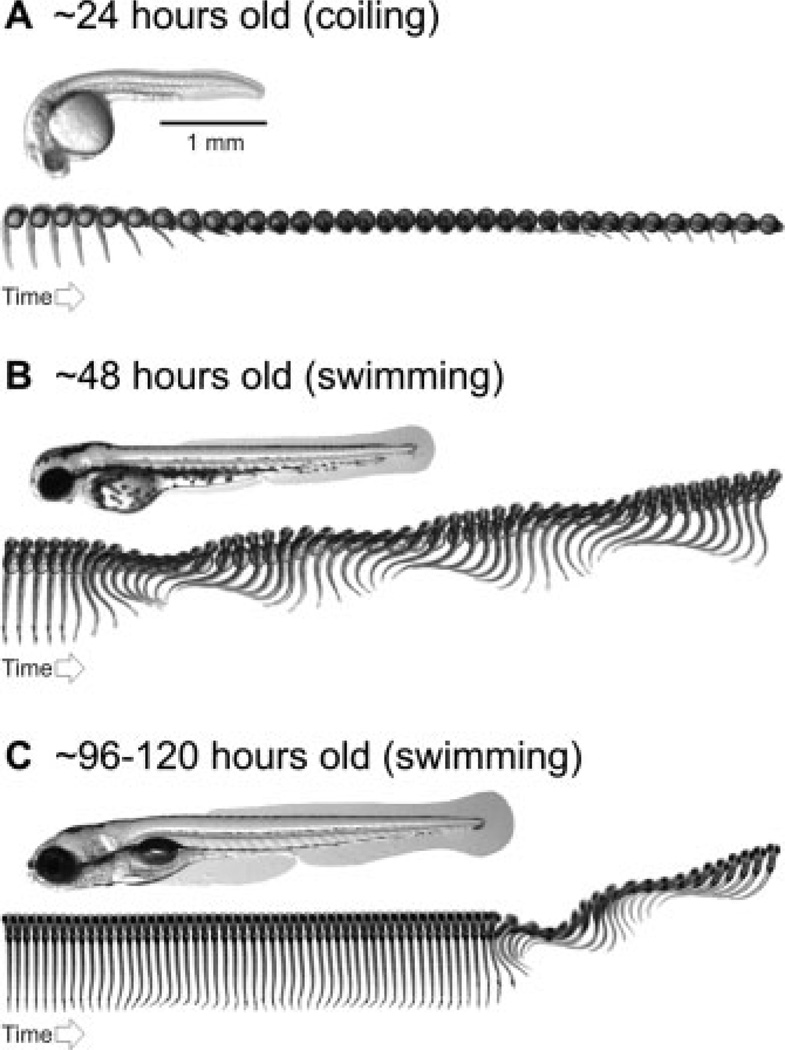
Stereotyped emergence of locomotor behavior in zebrafish. (A) Photograph of 1-day-old zebrafish embryo taken from the side, below which is a sequence of images captured at a rate of 1000 frames per second. The sequence illustrates spontaneous, embryonic coiling behavior. Each image is 20 ms apart. (B) Photograph of a 2-day-old zebrafish embryo taken from the side, below which is an image sequence captured at a rate of 1000 frames per second. The sequence illustrates swimming behavior elicited by a tactile stimulus to the tail. Each image is 2-ms apart. (C) Photograph of a 4- to 5-day-old zebrafish larva taken from the side, below which is an image sequence captured at a rate of 1000 frames per second. The sequence illustrates spontaneous swimming behavior, shortly followed by swimming evoked by a tactile stimulus to the tail. Each image is 2-ms apart. See Saint-Amant and Drapeau (1998); Budick and O’Malley (2000); Buss and Drapeau (2001); Thorsen et al. (2004); and the main text for more details.

Genetically encoded calcium imaging of olfactory bulb activity during development. (A) Inverse pericam expression driven by the neuronal promoter HuC labels cells in the olfactory bulb (left). Color-coded response patterns from the area outlined in green captured using wide-field epifluorescence and a cooled CCD camera are to the right and below. The responses to 14 different odor stimuli at 3 and 5 days post fertilization (dpf) from the same larva are illustrated. While signals are certainly stronger in older larvae, the broad spatial organization of odor responses is already apparent early on. Image reproduced from Li et al. (2005) with permission (Copyright 2005 by the Society for Neuroscience). Odorant abbreviations can be found in the original citation.

Tracking spinal network differentiation in vivo. (A) Schematic illustrating the photoconversion of Kaede protein using ultraviolet (UV) light. In this example, Kaede is restricted to the nervous system. Before conversion Kaede is green, and after conversion it is red. Any neurons containing red Kaede must have been present before conversion. Neurons with no red Kaede differentiated after conversion. (B) An example of the Kaede approach to time-stamp a specific class of spinal excitatory interneuron, circumferential descending (CiD) cells. Kaede expression was driven selectively into CiDs using an alx promoter. The top panel shows a merge of the red and green channels imaged using a confocal microscope, which are individually displayed below. The arrows indicate cells with both red and green fluorescence (yellow), while arrowheads indicate cells with red fluorescence, but marginal levels of green fluorescence. The time of conversion and imaging is as detailed in (A). Scale bar is 20 µm. Image in (B) is reproduced from Kimura et al. (2006) with permission (Copyright 2006 by the Society for Neuroscience).
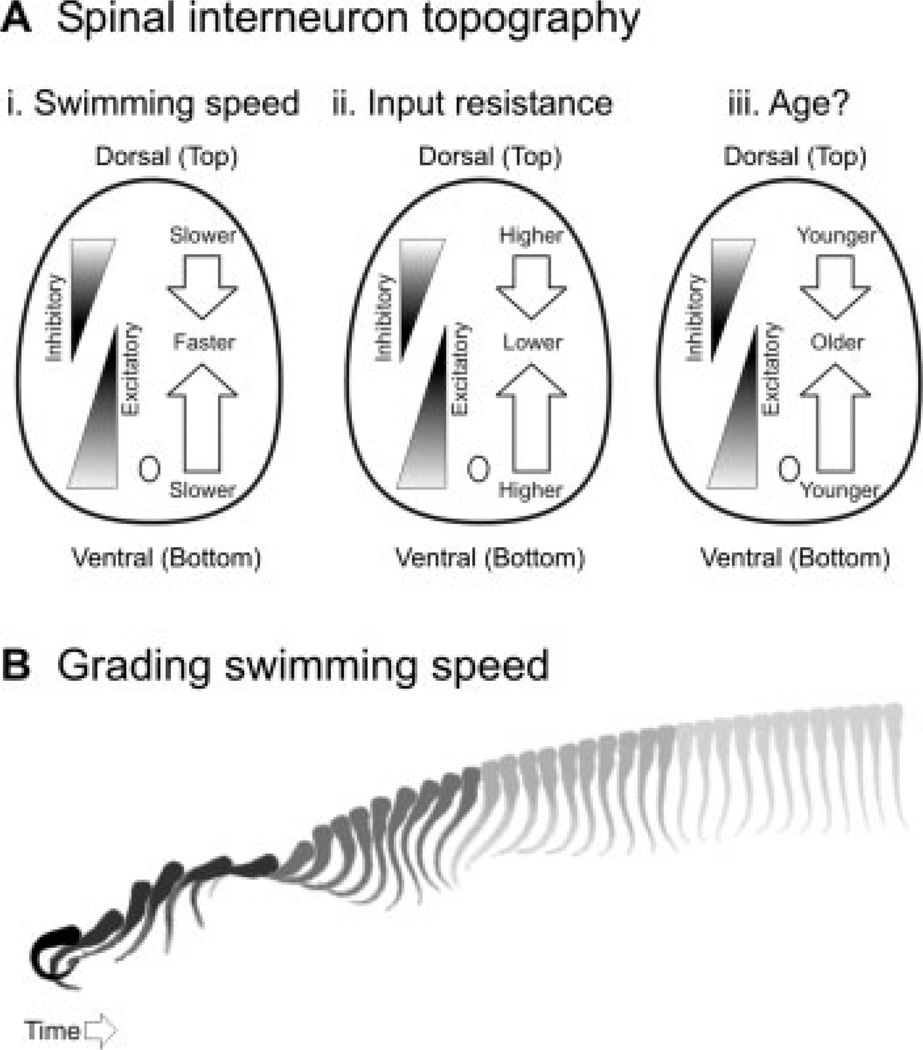
Gradients of recruitment in spinal cord and the relation to swimming speed. (A) Schematic illustrations of the dorso-ventral gradients of inhibitory and excitatory interneurons with respect to (i) swimming speed, (ii) input resistance, and, more speculatively, (iii) age. (B) Cartoon illustrating a larval zebrafish responding to a tactile stimulus with an escape bend and a bout of swimming. As the speed of the swimming bout decreases, so too does the shade. This is meant to reflect the relative participation of spinal networks driving slow versus faster movements according to the topographic arrangement illustrated in (A). The image sequence was captured at a rate of 1000 Hz and each image is 4-ms apart.
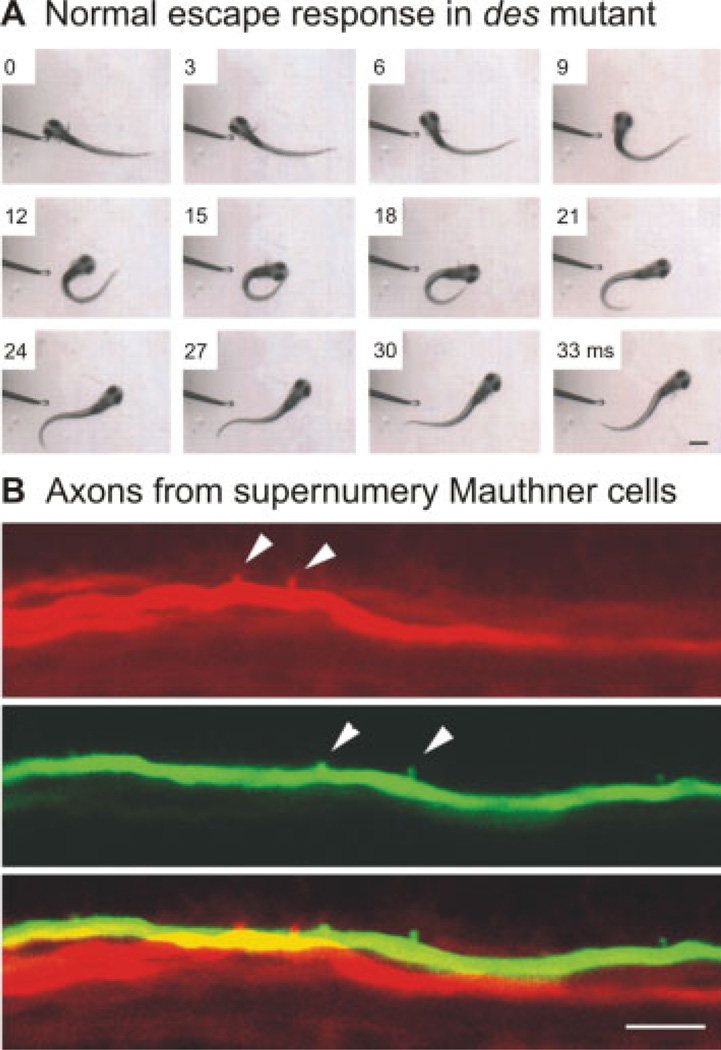
Deadly seven/notch1a (des) mutants display homeostatic plasticity in the escape circuit. (A) An escape in response to a tactile stimulus to the head appears normal in this des mutant. The larva turns quickly from the stimulus and begins to swim away. Images were captured at 1000 Hz, and every third frame is shown. The time in milliseconds is marked on the frames. Scale bar is 550 µm. (B) A mutation in the des/notch1a gene results in multiple Mauthner cells, two of which have been electroporated here with different colored fluorescent dyes and imaged using a confocal microscope. Arrowheads denote axon collaterals, which do not form in the same location as the merged image at the bottom demonstrates. Scale bar is 10 µm. Images reproduced from Liu et al. (2003) with permission (Copyright 2003 by the Society for Neuroscience).
Similar articles
-
Modeling spinal locomotor circuits for movements in developing zebrafish.Elife. 2021 Sep 2;10:e67453. doi: 10.7554/eLife.67453. Elife. 2021. PMID: 34473059 Free PMC article.
-
Imaging circuit formation in zebrafish.Dev Neurobiol. 2012 Mar;72(3):346-57. doi: 10.1002/dneu.20874. Dev Neurobiol. 2012. PMID: 21309080 Review.
-
Spinal interneurons differentiate sequentially from those driving the fastest swimming movements in larval zebrafish to those driving the slowest ones.J Neurosci. 2009 Oct 28;29(43):13566-77. doi: 10.1523/JNEUROSCI.3277-09.2009. J Neurosci. 2009. PMID: 19864569 Free PMC article.
-
Movement, technology and discovery in the zebrafish.Curr Opin Neurobiol. 2011 Feb;21(1):110-5. doi: 10.1016/j.conb.2010.09.011. Epub 2010 Oct 20. Curr Opin Neurobiol. 2011. PMID: 20970321 Free PMC article. Review.
-
Live-imaging of astrocyte morphogenesis and function in zebrafish neural circuits.Nat Neurosci. 2020 Oct;23(10):1297-1306. doi: 10.1038/s41593-020-0703-x. Epub 2020 Sep 7. Nat Neurosci. 2020. PMID: 32895565 Free PMC article.
Cited by
-
Integrating anatomy and function for zebrafish circuit analysis.Front Neural Circuits. 2013 Apr 23;7:74. doi: 10.3389/fncir.2013.00074. eCollection 2013. Front Neural Circuits. 2013. PMID: 23630469 Free PMC article. Review.
-
Optogenetic Dissection of Neuronal Circuits in Zebrafish using Viral Gene Transfer and the Tet System.Front Neural Circuits. 2009 Dec 11;3:21. doi: 10.3389/neuro.04.021.2009. eCollection 2009. Front Neural Circuits. 2009. PMID: 20126518 Free PMC article.
-
Spinal Hb9::Cre-derived excitatory interneurons contribute to rhythm generation in the mouse.Sci Rep. 2017 Jan 27;7:41369. doi: 10.1038/srep41369. Sci Rep. 2017. PMID: 28128321 Free PMC article.
-
Glutamate drives the touch response through a rostral loop in the spinal cord of zebrafish embryos.Dev Neurobiol. 2009 Oct;69(12):780-95. doi: 10.1002/dneu.20741. Dev Neurobiol. 2009. PMID: 19634126 Free PMC article.
-
Some principles of organization of spinal neurons underlying locomotion in zebrafish and their implications.Ann N Y Acad Sci. 2010 Jun;1198:94-104. doi: 10.1111/j.1749-6632.2010.05539.x. Ann N Y Acad Sci. 2010. PMID: 20536924 Free PMC article.
References
-
- Amsterdam A, Hopkins N. Mutagenesis strategies in zebrafish for identifying genes involved in development and disease. Trends Genet. 2006;22:473–478. - PubMed
-
- Aramaki S, Hatta K. Visualizing neurons one-by-one in vivo: Optical dissection and reconstruction of neural networks with reversible fluorescent proteins. Dev Dyn. 2006;235:2192–2199. - PubMed
-
- Bargmann CI, Hartwieg E, Horvitz HR. Odorantselective genes and neurons mediate olfaction in Celegans. Cell. 1993;74:515–527. - PubMed
-
- Bartelmez GW. Mauthner’s cell and the nucleus motorius tegmenti. J Comp Neurol. 1915;25:87–128.
Publication types
MeSH terms
Grants and funding
LinkOut - more resources
Full Text Sources
Medical
