Comment
. 2008 Feb;35(2):435-45.
doi: 10.1118/1.2820902.

Operating characteristics predicted by models for diagnostic tasks involving lesion localization

Affiliations
Comment

Operating characteristics predicted by models for diagnostic tasks involving lesion localization

D P Chakraborty et al. Med Phys. 2008 Feb.

Abstract

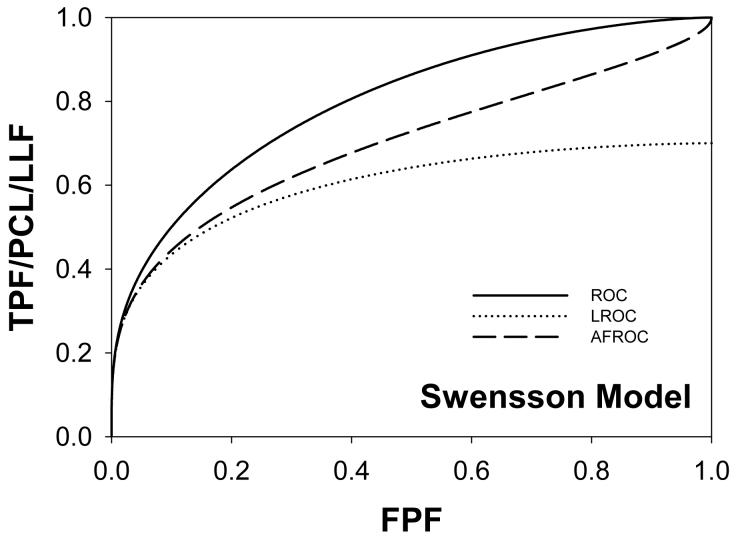
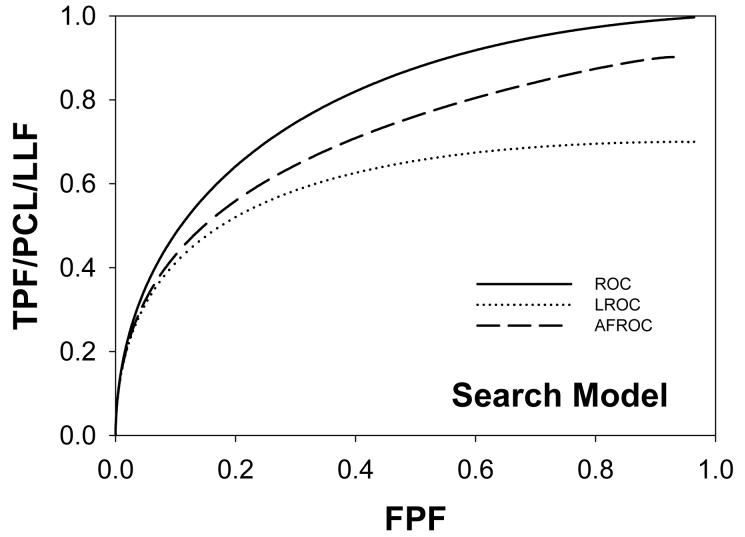
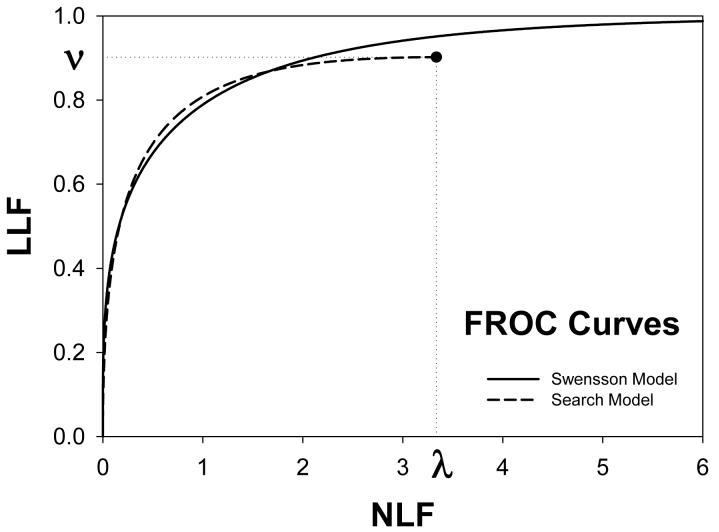
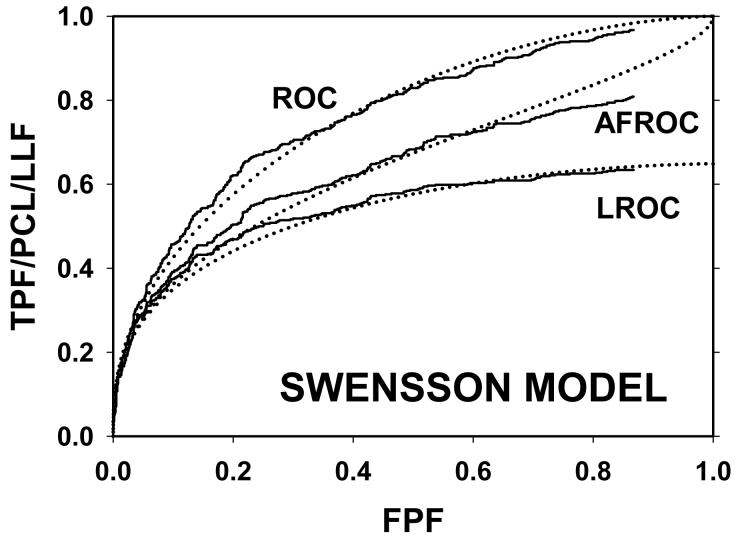
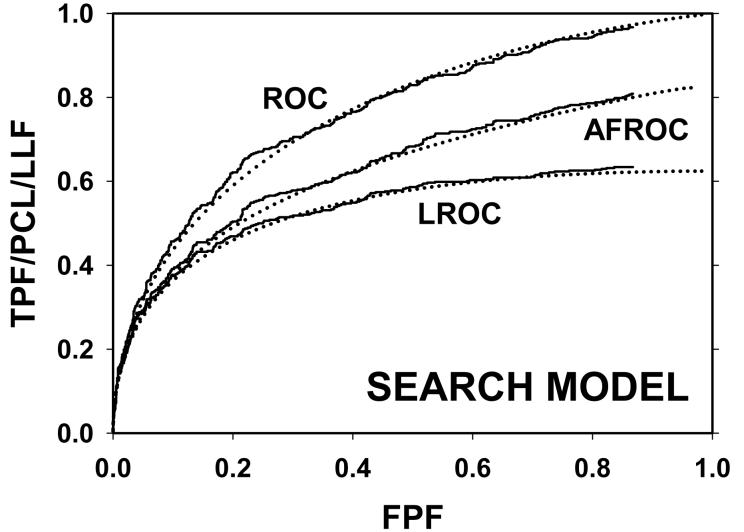
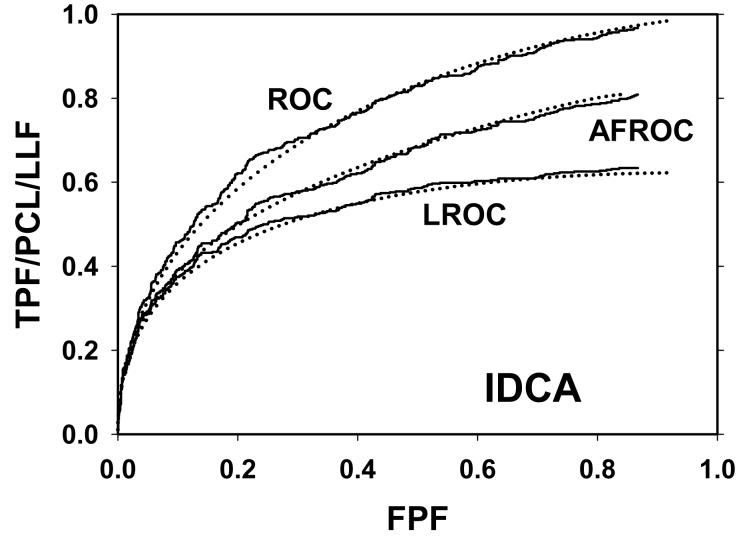
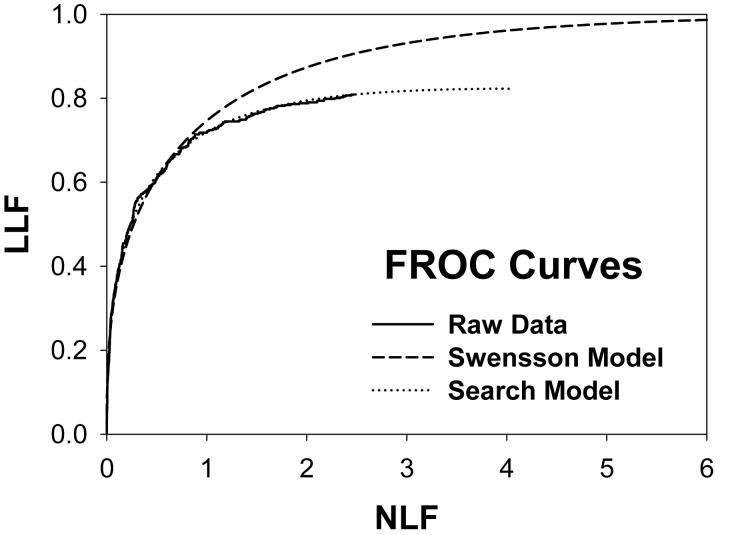
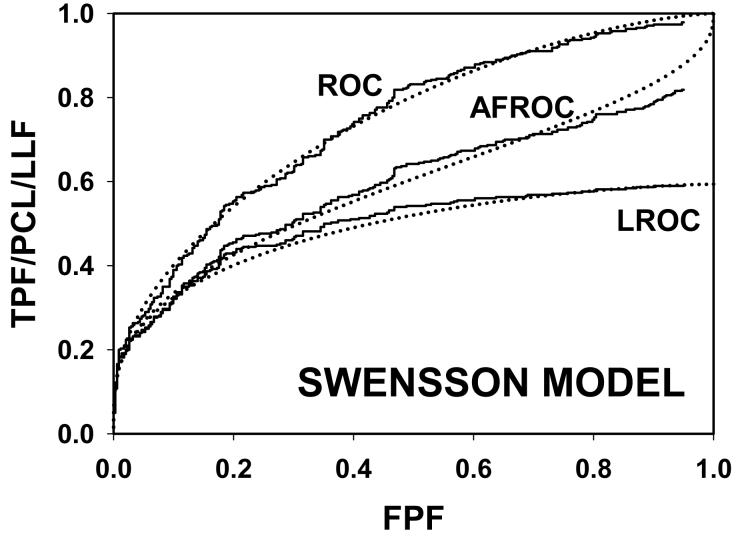
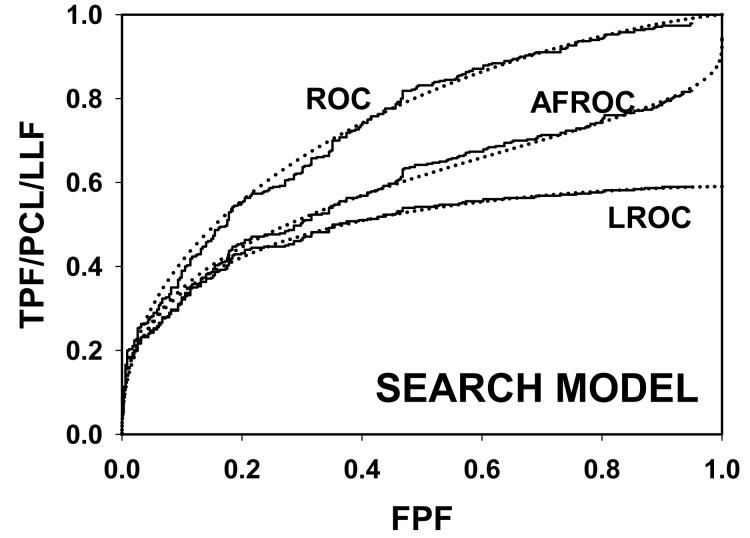
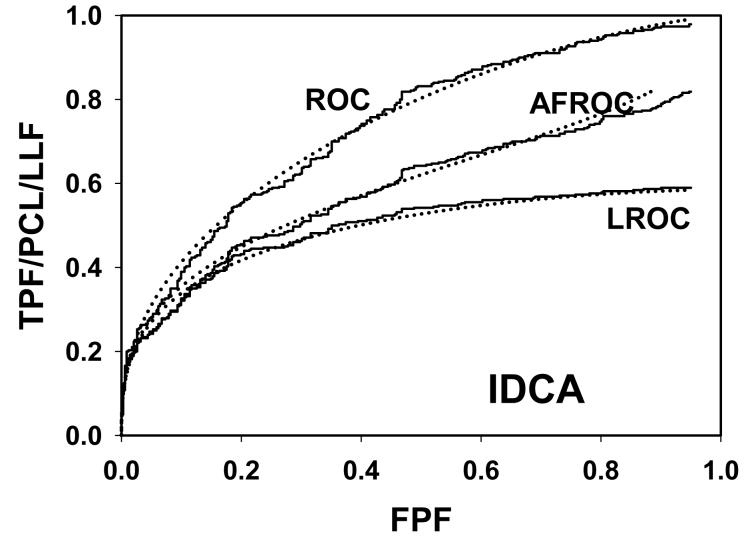
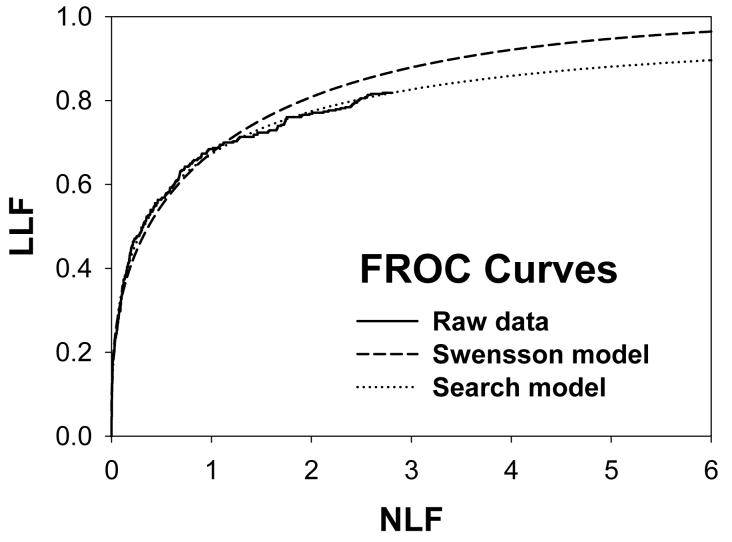
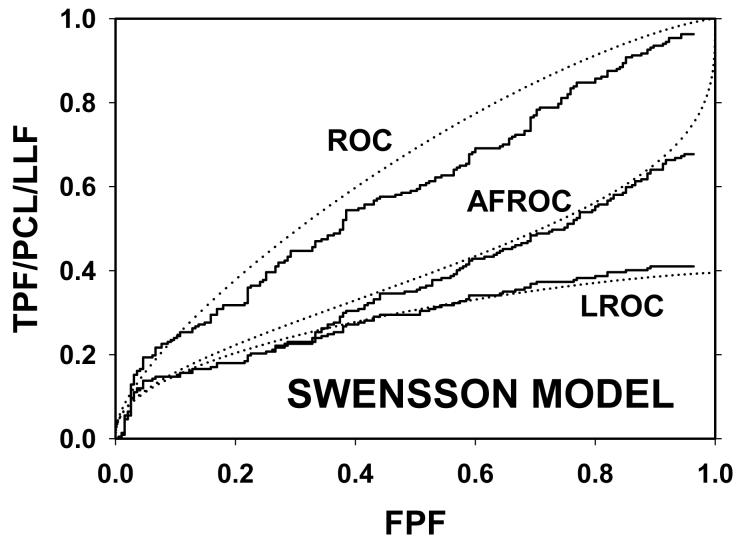
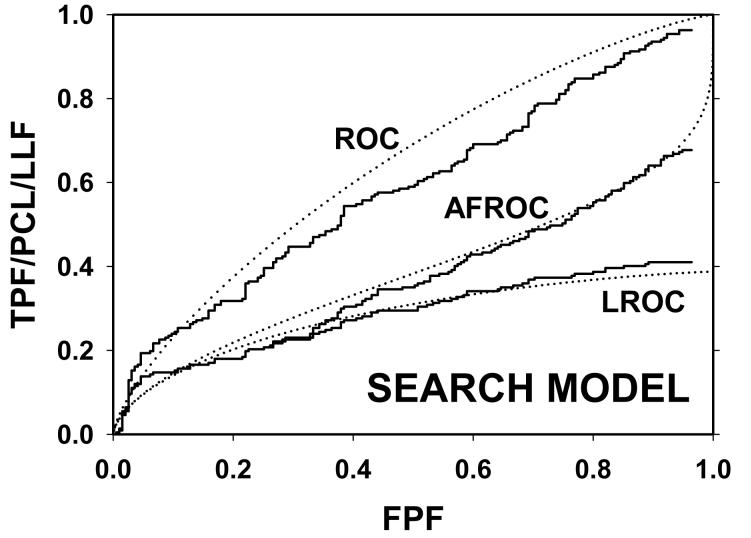
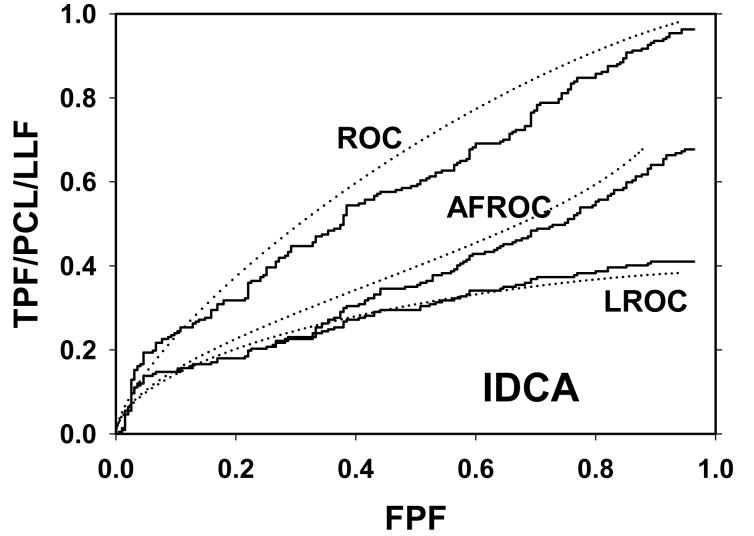
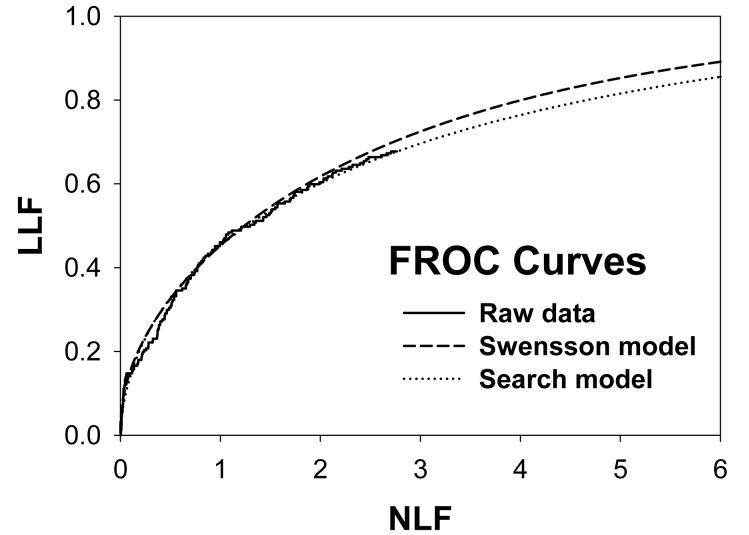
In 1996 Swensson published an observer model that predicted receiver operating characteristic (ROC), localization ROC (LROC), free-response ROC (FROC) and alternative FROC (AFROC) curves, thereby achieving "unification" of different observer performance paradigms. More recently a model termed initial detection and candidate analysis (IDCA) has been proposed for fitting computer aided detection (CAD) generated FROC data, and recently a search model for human observer FROC data has been proposed. The purpose of this study was to derive IDCA and the search model based expressions for operating characteristics, and to compare the predictions to the Swensson model. For three out of four mammography CAD data sets all models yielded good fits in the high-confidence region, i.e., near the lower end of the plots. The search model and IDCA tended to better fit the data in the low-confidence region, i.e., near the upper end of the plots, particularly for FROC curves for which the Swensson model predictions departed markedly from the data. For one data set none of the models yielded satisfactory fits. A unique characteristic of search model and IDCA predicted operating characteristics is that the operating point is not allowed to move continuously to the lowest confidence limit of the corresponding Swensson model curves. This prediction is actually observed in the CAD raw data and it is the primary reason for the poor FROC fits of the Swensson model in the low-confidence region.

Keywords: IDCA; LROC model; lesion localization; operating characteristics; search model.


Figures

Figure 1
Figure 1
Swensson and search model curves generated with parameters chosen to yield identical areas under the ROC curve = 0.8 and limiting LROC ordinates = 0.7. Fig. 1(a) shows ROC, LROC and AFROC curves predicted by Swensson's model, Fig. 1(b) shows corresponding search model curves and Fig. 1(c) shows FROC curves. FPF = false positive fraction, TPF = true positive fraction, PCL = probability of correct localization, NLF = non-lesion localization fraction = average # non-lesions per image, LLF = lesion localization fraction = probability that a lesion is localized. The Swensson model ROC and AFROC curves extend to the upper right corner (1, 1) whereas the corresponding search model curves do not (this is an example of the finite end-point property of all search model predicted curves). The Swensson model LROC curve abscissa extends to FPF = 1 but the search model curve does not. The Swensson model FROC does not terminate inside the plotted range, in fact it extends to (∞, 1) whereas the search model FROC curve ends inside the plotted range. For this example the IDCA predictions (not shown) are identical to the search model.
Figure 1
Figure 1
Swensson and search model curves generated with parameters chosen to yield identical areas under the ROC curve = 0.8 and limiting LROC ordinates = 0.7. Fig. 1(a) shows ROC, LROC and AFROC curves predicted by Swensson's model, Fig. 1(b) shows corresponding search model curves and Fig. 1(c) shows FROC curves. FPF = false positive fraction, TPF = true positive fraction, PCL = probability of correct localization, NLF = non-lesion localization fraction = average # non-lesions per image, LLF = lesion localization fraction = probability that a lesion is localized. The Swensson model ROC and AFROC curves extend to the upper right corner (1, 1) whereas the corresponding search model curves do not (this is an example of the finite end-point property of all search model predicted curves). The Swensson model LROC curve abscissa extends to FPF = 1 but the search model curve does not. The Swensson model FROC does not terminate inside the plotted range, in fact it extends to (∞, 1) whereas the search model FROC curve ends inside the plotted range. For this example the IDCA predictions (not shown) are identical to the search model.
Figure 2
Figure 2
Comparison of the predictions for CAD data set B: (a) Swensson model ROC, AFROC, and LROC curves; (b) corresponding search model fits; (c) corresponding IDCA model fits; and (d) FROC curves predicted by the Swensson and search models (the IDCA fit, not shown, is very close to the search model fit but it stops exactly at the observed end-point). All models yielded reasonable fits in the high-confidence region of the plots. IDCA and search model ROC and AFROC fits (b and c) are slightly better in the low-confidence region of the plots. In the low-confidence region (NLF > 1) of the FROC plot the Swensson model fit deviated substantially from the data but the search model and IDCA yielded excellent fits.
Figure 2
Figure 2
Comparison of the predictions for CAD data set B: (a) Swensson model ROC, AFROC, and LROC curves; (b) corresponding search model fits; (c) corresponding IDCA model fits; and (d) FROC curves predicted by the Swensson and search models (the IDCA fit, not shown, is very close to the search model fit but it stops exactly at the observed end-point). All models yielded reasonable fits in the high-confidence region of the plots. IDCA and search model ROC and AFROC fits (b and c) are slightly better in the low-confidence region of the plots. In the low-confidence region (NLF > 1) of the FROC plot the Swensson model fit deviated substantially from the data but the search model and IDCA yielded excellent fits.
Figure 3
Figure 3
Comparison of the predictions for CAD data set D: (a) Swensson model ROC, AFROC, and LROC curves; (b) corresponding search model fits; (c) corresponding IDCA model fits; and (d) FROC curves for Swensson and search models. These exhibit the same trends as in Fig. 2.
Figure 3
Figure 3
Comparison of the predictions for CAD data set D: (a) Swensson model ROC, AFROC, and LROC curves; (b) corresponding search model fits; (c) corresponding IDCA model fits; and (d) FROC curves for Swensson and search models. These exhibit the same trends as in Fig. 2.
Figure 3
Figure 3
Comparison of the predictions for CAD data set D: (a) Swensson model ROC, AFROC, and LROC curves; (b) corresponding search model fits; (c) corresponding IDCA model fits; and (d) FROC curves for Swensson and search models. These exhibit the same trends as in Fig. 2.
Figure 3
Figure 3
Comparison of the predictions for CAD data set D: (a) Swensson model ROC, AFROC, and LROC curves; (b) corresponding search model fits; (c) corresponding IDCA model fits; and (d) FROC curves for Swensson and search models. These exhibit the same trends as in Fig. 2.
Figure 4
Figure 4
Comparison of the predictions for CAD data set C: (a) Swensson model fitted ROC, AFROC, and LROC curves; (b) corresponding search model fits; (c) corresponding IDCA model fits; and (d) FROC curves for Swensson and search models. None of the models yielded satisfactory fits to this data set.
Figure 4
Figure 4
Comparison of the predictions for CAD data set C: (a) Swensson model fitted ROC, AFROC, and LROC curves; (b) corresponding search model fits; (c) corresponding IDCA model fits; and (d) FROC curves for Swensson and search models. None of the models yielded satisfactory fits to this data set.

Comment on

Similar articles

Cited by

References

    1. Metz CE. ROC Methodology in Radiologic Imaging. Investigative Radiology. 1986;21(9):720–733. - PubMed
    1. Metz CE. Receiver Operating Characteristic Analysis: A Tool for the Quantitative Evaluation of Observer Performance and Imaging Systems. J Am Coll Radiol. 2006;3:413–422. - PubMed
    1. Egan JP, Greenburg GZ, Schulman AI. Operating characteristics, signal detectability and the method of free response. J Acoust Soc. Am. 1961;33:993–1007.
    1. Bunch PC, Hamilton JF, Sanderson GK, Simmons AH. A Free-Response Approach to the Measurement and Characterization of Radiographic-Observer Performance. J of Appl Photogr. Eng. 1978;4(4):166–171.
    1. Chakraborty DP, Winter LHL. Free-Response Methodology: Alternate Analysis and a New Observer-Performance Experiment. Radiology. 1990;174:873–881. - PubMed