

doi: 10.1118/1.2826559.
Measurement of temporal resolution in dual source CT
Affiliations
- PMID: 18383698
- PMCID: PMC2701968
- DOI: 10.1118/1.2826559
Item in Clipboard
Measurement of temporal resolution in dual source CT
Med Phys.
2008 Feb.
Abstract
This work assesses the temporal resolution of dual-source computed tomography (CT) in a visually intuitive manner. Exploiting the principles of ring artifact creation, a phantom containing a highly attenuating delta function signal (a wire) was rotated at the same speed as the gantry, creating a partial ring artifact where the angular extent of the artifact provides a direct indication of the temporal resolution. A demonstration of the effect of the evaluated 165 and 83 ms nominal temporal resolutions on motion artifacts in cardiac CT is provided using patient data.
Figures
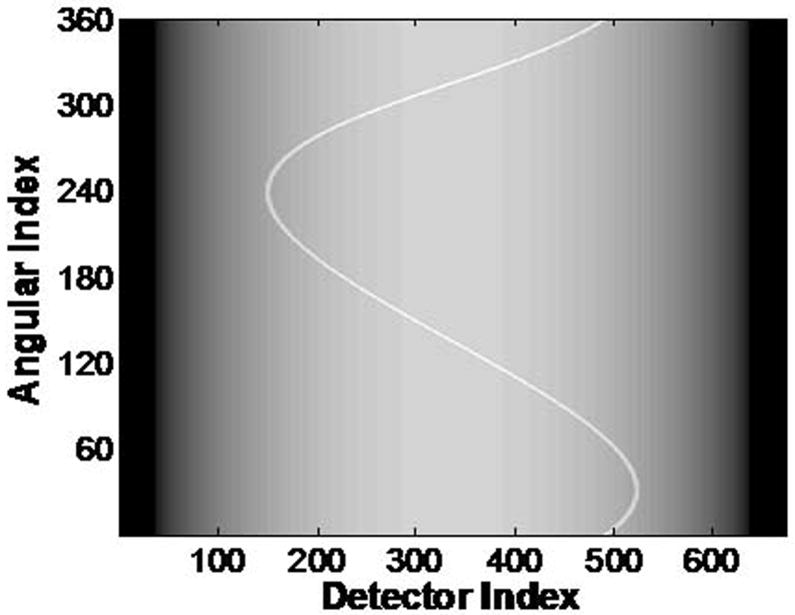
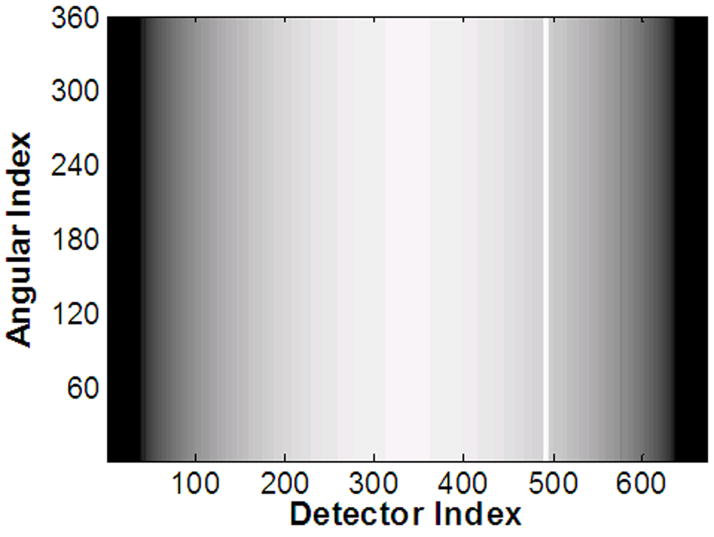
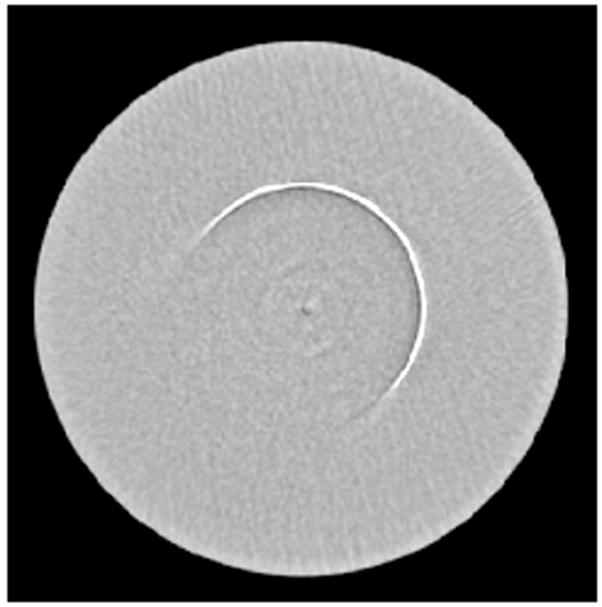
Simulation of sinograms (a, c) and corresponding reconstructed images (b,d) of a highly-attenuating “delta function” object in a uniformly dark cylindrical background for a stationary phantom and full-scan (360°) reconstruction (a, b) and the same phantom rotated at the same speed and direction as the gantry (c, d), also with a full-scan reconstruction. A ring artifact is created in 3rd generation CT when a ray sum is corrupted, typically due to a bad detector or problem with the x-ray source. The same effect occurs if a ray sum is blocked for every projection angle, in this case due to synchronous rotation of the gantry and phantom. If less than 360° are used in the scan reconstruction, the ring will be incomplete, covering only the angular range included in the image reconstruction. The radius of the ring in the reconstructed image depends on the position of the wire in the field of view at the beginning of the scan, which determines the location of the wire’s signal at a specific detector in the sinogram.

Simulation of sinograms (a, c) and corresponding reconstructed images (b,d) of a highly-attenuating “delta function” object in a uniformly dark cylindrical background for a stationary phantom and full-scan (360°) reconstruction (a, b) and the same phantom rotated at the same speed and direction as the gantry (c, d), also with a full-scan reconstruction. A ring artifact is created in 3rd generation CT when a ray sum is corrupted, typically due to a bad detector or problem with the x-ray source. The same effect occurs if a ray sum is blocked for every projection angle, in this case due to synchronous rotation of the gantry and phantom. If less than 360° are used in the scan reconstruction, the ring will be incomplete, covering only the angular range included in the image reconstruction. The radius of the ring in the reconstructed image depends on the position of the wire in the field of view at the beginning of the scan, which determines the location of the wire’s signal at a specific detector in the sinogram.
Simulation of sinograms (a, c) and corresponding reconstructed images (b,d) of a highly-attenuating “delta function” object in a uniformly dark cylindrical background for a stationary phantom and full-scan (360°) reconstruction (a, b) and the same phantom rotated at the same speed and direction as the gantry (c, d), also with a full-scan reconstruction. A ring artifact is created in 3rd generation CT when a ray sum is corrupted, typically due to a bad detector or problem with the x-ray source. The same effect occurs if a ray sum is blocked for every projection angle, in this case due to synchronous rotation of the gantry and phantom. If less than 360° are used in the scan reconstruction, the ring will be incomplete, covering only the angular range included in the image reconstruction. The radius of the ring in the reconstructed image depends on the position of the wire in the field of view at the beginning of the scan, which determines the location of the wire’s signal at a specific detector in the sinogram.

Simulation of sinograms (a, c) and corresponding reconstructed images (b,d) of a highly-attenuating “delta function” object in a uniformly dark cylindrical background for a stationary phantom and full-scan (360°) reconstruction (a, b) and the same phantom rotated at the same speed and direction as the gantry (c, d), also with a full-scan reconstruction. A ring artifact is created in 3rd generation CT when a ray sum is corrupted, typically due to a bad detector or problem with the x-ray source. The same effect occurs if a ray sum is blocked for every projection angle, in this case due to synchronous rotation of the gantry and phantom. If less than 360° are used in the scan reconstruction, the ring will be incomplete, covering only the angular range included in the image reconstruction. The radius of the ring in the reconstructed image depends on the position of the wire in the field of view at the beginning of the scan, which determines the location of the wire’s signal at a specific detector in the sinogram.
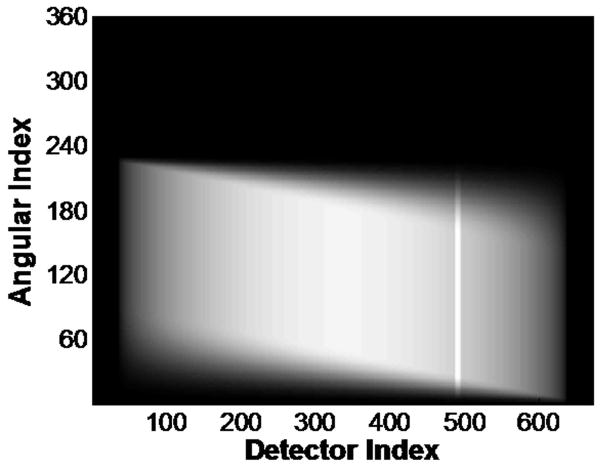
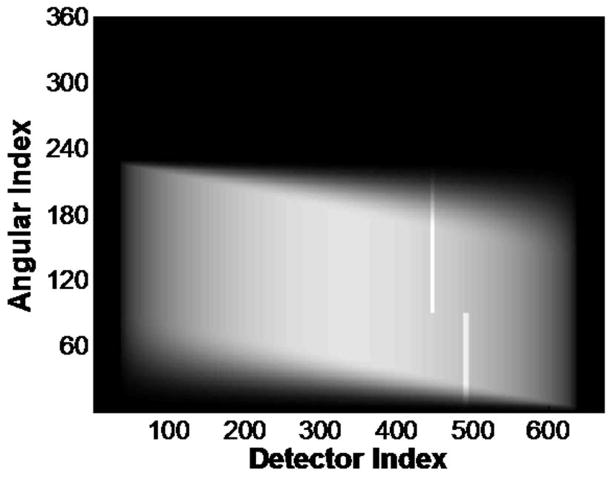
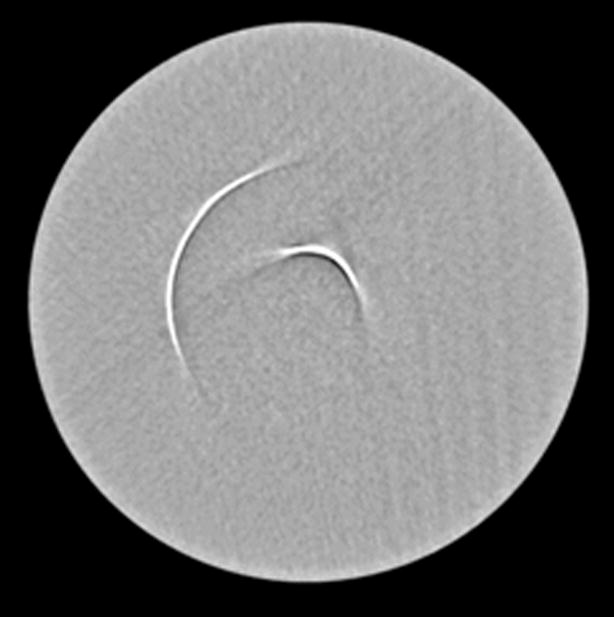
Simulations of sinograms (a, c) and corresponding reconstructed images (b, d) of the same phantom shown in Figure 1. (a, b) The phantom was rotated at the same speed and direction as the gantry. The image was reconstructed from half-scan (180° + fan angle) data after smoothing of the sinogram using the Parker weighting. (c, d) The phantom was rotated at the same speed and direction as the gantry, while the image was reconstructed from the half-scan data formed from the combination of data acquired by two orthogonal x-ray sources. This sinogram was also smoothed by using the Parker weighting. Each x-ray source produces an arc that independently corresponds to the temporal resolution of the scan. Thus, two one-quarter rotation arcs are generated

Simulations of sinograms (a, c) and corresponding reconstructed images (b, d) of the same phantom shown in Figure 1. (a, b) The phantom was rotated at the same speed and direction as the gantry. The image was reconstructed from half-scan (180° + fan angle) data after smoothing of the sinogram using the Parker weighting. (c, d) The phantom was rotated at the same speed and direction as the gantry, while the image was reconstructed from the half-scan data formed from the combination of data acquired by two orthogonal x-ray sources. This sinogram was also smoothed by using the Parker weighting. Each x-ray source produces an arc that independently corresponds to the temporal resolution of the scan. Thus, two one-quarter rotation arcs are generated
Simulations of sinograms (a, c) and corresponding reconstructed images (b, d) of the same phantom shown in Figure 1. (a, b) The phantom was rotated at the same speed and direction as the gantry. The image was reconstructed from half-scan (180° + fan angle) data after smoothing of the sinogram using the Parker weighting. (c, d) The phantom was rotated at the same speed and direction as the gantry, while the image was reconstructed from the half-scan data formed from the combination of data acquired by two orthogonal x-ray sources. This sinogram was also smoothed by using the Parker weighting. Each x-ray source produces an arc that independently corresponds to the temporal resolution of the scan. Thus, two one-quarter rotation arcs are generated

Simulations of sinograms (a, c) and corresponding reconstructed images (b, d) of the same phantom shown in Figure 1. (a, b) The phantom was rotated at the same speed and direction as the gantry. The image was reconstructed from half-scan (180° + fan angle) data after smoothing of the sinogram using the Parker weighting. (c, d) The phantom was rotated at the same speed and direction as the gantry, while the image was reconstructed from the half-scan data formed from the combination of data acquired by two orthogonal x-ray sources. This sinogram was also smoothed by using the Parker weighting. Each x-ray source produces an arc that independently corresponds to the temporal resolution of the scan. Thus, two one-quarter rotation arcs are generated
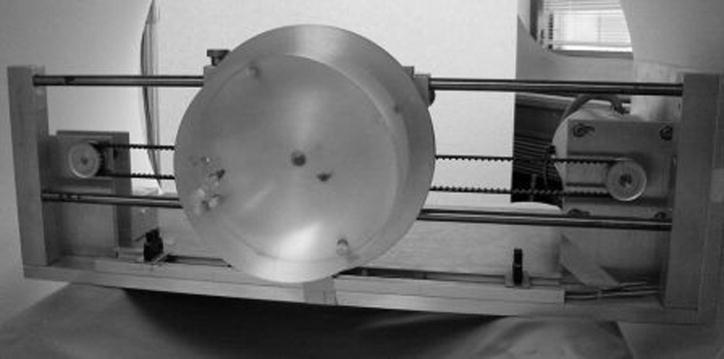
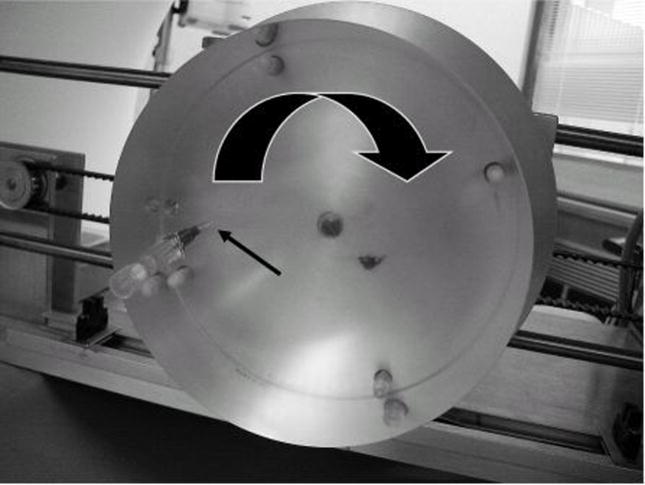
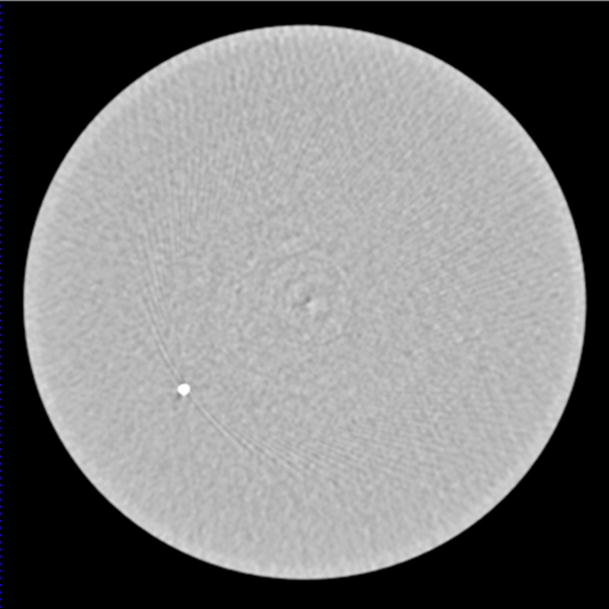
(a) Photograph of the motion apparatus within the gantry of the CT system and a close-up of the phantom (b). The 22 gauge hypodermic needle inserted into the 15 cm acrylic cylinder is indicated by the narrow black arrow. The large arrow indicates the direction of rotation. The screws that mount the acrylic phantom to the metal plate of the motion apparatus are visible through the clear acrylic. Using a computer-controlled stepping motor, the phantom was rotated at 3 rotations per second to match the rotation time of the gantry. (c) A CT image of the static phantom demonstrates the appearance of the metal needle.
(a) Photograph of the motion apparatus within the gantry of the CT system and a close-up of the phantom (b). The 22 gauge hypodermic needle inserted into the 15 cm acrylic cylinder is indicated by the narrow black arrow. The large arrow indicates the direction of rotation. The screws that mount the acrylic phantom to the metal plate of the motion apparatus are visible through the clear acrylic. Using a computer-controlled stepping motor, the phantom was rotated at 3 rotations per second to match the rotation time of the gantry. (c) A CT image of the static phantom demonstrates the appearance of the metal needle.
(a) Photograph of the motion apparatus within the gantry of the CT system and a close-up of the phantom (b). The 22 gauge hypodermic needle inserted into the 15 cm acrylic cylinder is indicated by the narrow black arrow. The large arrow indicates the direction of rotation. The screws that mount the acrylic phantom to the metal plate of the motion apparatus are visible through the clear acrylic. Using a computer-controlled stepping motor, the phantom was rotated at 3 rotations per second to match the rotation time of the gantry. (c) A CT image of the static phantom demonstrates the appearance of the metal needle.
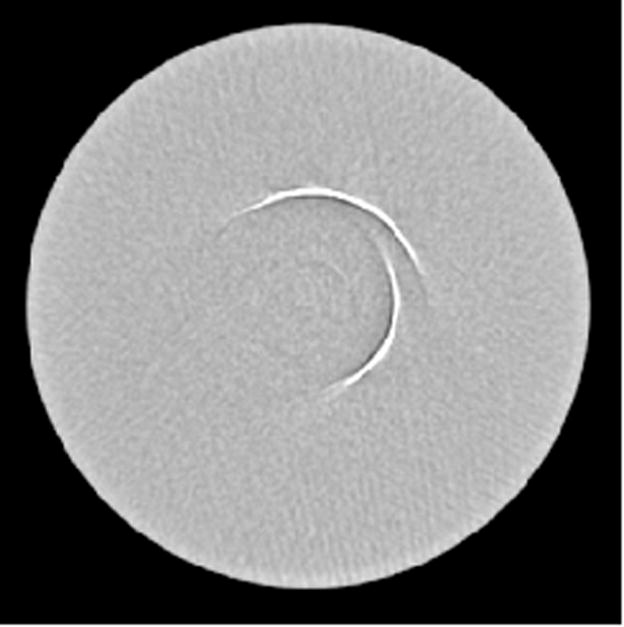
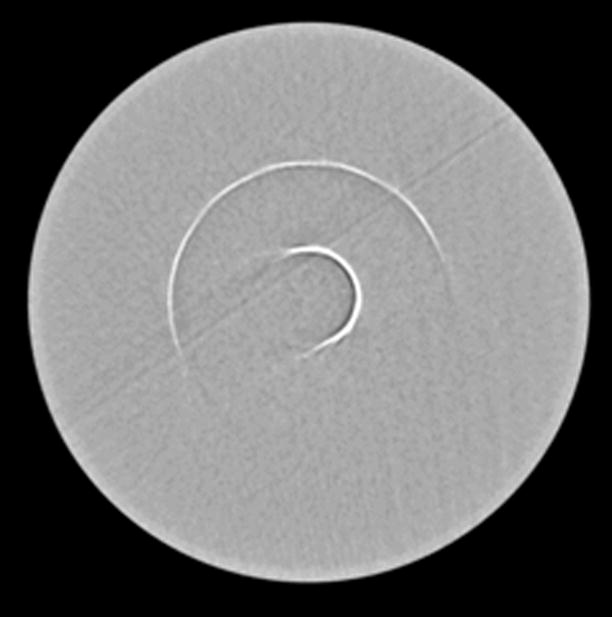
(a) Partial scan reconstruction performed using data from both Tube A and Tube B (i.e. a cardiac dual-source reconstruction) for the axial scan acquisition. The mean angular extent of the partial ring artifacts (n=5) was 87.6°, which corresponds to 80.3 ms. (b) Partial scan reconstruction using only data from Tube A (i.e. a cardiac single-source reconstruction) for the axial scan reconstruction. The mean angular extent of the partial ring artifacts (n=5) was 177.2°, which corresponds to a temporal resolution of 162.4 ms. (c) Partial scan reconstruction performed using data from both tubes for the helical scan acquisition. The angular extent of the partial ring artifacts (n=5) was 87.4°, which corresponds to 80.1 ms. (d) Partial scan reconstruction performed using 180° of projection data from both tube A and tube B for the helical scan acquisition. Reconstruction of the longer temporal window (165 ms) from a dual-source helical scan is a reconstruction option on the CT system used. The mean angular extent of the partial ring artifacts (n=5) was 182.2°, which corresponds to a temporal resolution of 167.0 ms.
(a) Partial scan reconstruction performed using data from both Tube A and Tube B (i.e. a cardiac dual-source reconstruction) for the axial scan acquisition. The mean angular extent of the partial ring artifacts (n=5) was 87.6°, which corresponds to 80.3 ms. (b) Partial scan reconstruction using only data from Tube A (i.e. a cardiac single-source reconstruction) for the axial scan reconstruction. The mean angular extent of the partial ring artifacts (n=5) was 177.2°, which corresponds to a temporal resolution of 162.4 ms. (c) Partial scan reconstruction performed using data from both tubes for the helical scan acquisition. The angular extent of the partial ring artifacts (n=5) was 87.4°, which corresponds to 80.1 ms. (d) Partial scan reconstruction performed using 180° of projection data from both tube A and tube B for the helical scan acquisition. Reconstruction of the longer temporal window (165 ms) from a dual-source helical scan is a reconstruction option on the CT system used. The mean angular extent of the partial ring artifacts (n=5) was 182.2°, which corresponds to a temporal resolution of 167.0 ms.
(a) Partial scan reconstruction performed using data from both Tube A and Tube B (i.e. a cardiac dual-source reconstruction) for the axial scan acquisition. The mean angular extent of the partial ring artifacts (n=5) was 87.6°, which corresponds to 80.3 ms. (b) Partial scan reconstruction using only data from Tube A (i.e. a cardiac single-source reconstruction) for the axial scan reconstruction. The mean angular extent of the partial ring artifacts (n=5) was 177.2°, which corresponds to a temporal resolution of 162.4 ms. (c) Partial scan reconstruction performed using data from both tubes for the helical scan acquisition. The angular extent of the partial ring artifacts (n=5) was 87.4°, which corresponds to 80.1 ms. (d) Partial scan reconstruction performed using 180° of projection data from both tube A and tube B for the helical scan acquisition. Reconstruction of the longer temporal window (165 ms) from a dual-source helical scan is a reconstruction option on the CT system used. The mean angular extent of the partial ring artifacts (n=5) was 182.2°, which corresponds to a temporal resolution of 167.0 ms.
(a) Partial scan reconstruction performed using data from both Tube A and Tube B (i.e. a cardiac dual-source reconstruction) for the axial scan acquisition. The mean angular extent of the partial ring artifacts (n=5) was 87.6°, which corresponds to 80.3 ms. (b) Partial scan reconstruction using only data from Tube A (i.e. a cardiac single-source reconstruction) for the axial scan reconstruction. The mean angular extent of the partial ring artifacts (n=5) was 177.2°, which corresponds to a temporal resolution of 162.4 ms. (c) Partial scan reconstruction performed using data from both tubes for the helical scan acquisition. The angular extent of the partial ring artifacts (n=5) was 87.4°, which corresponds to 80.1 ms. (d) Partial scan reconstruction performed using 180° of projection data from both tube A and tube B for the helical scan acquisition. Reconstruction of the longer temporal window (165 ms) from a dual-source helical scan is a reconstruction option on the CT system used. The mean angular extent of the partial ring artifacts (n=5) was 182.2°, which corresponds to a temporal resolution of 167.0 ms.
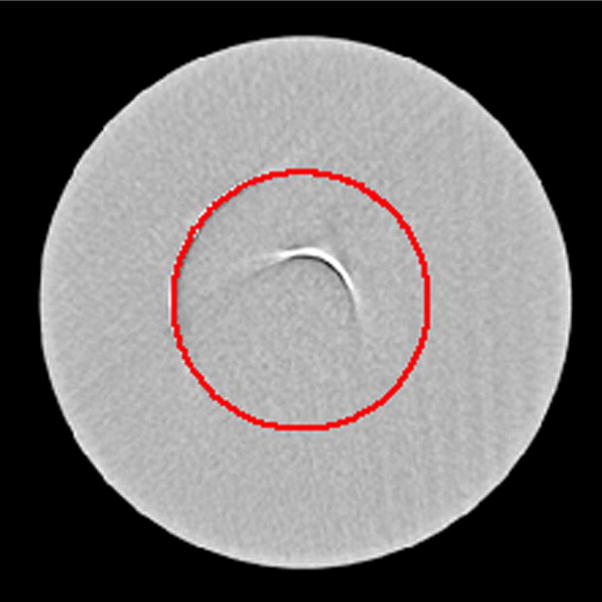
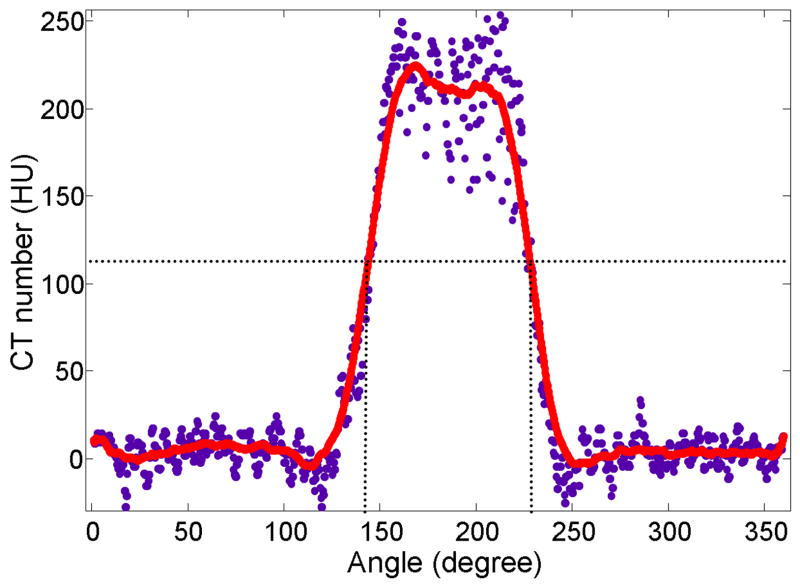
Demonstration of the method used to measure the angular extent of the partial ring artifact. a) The image shown in Figure 4a with a circle manually fit to the radius of curvature of the outermost arc. b) Plot of the background-corrected CT number versus angular position of the values underneath the circle overlay (blue data points). A 101-voxel wide sliding average smoothing was performed (red line) to reduce the influence on noise. The FWHM of the smoothed profile was used to quantitate the temporal resolution of the associated scan mode.
Demonstration of the method used to measure the angular extent of the partial ring artifact. a) The image shown in Figure 4a with a circle manually fit to the radius of curvature of the outermost arc. b) Plot of the background-corrected CT number versus angular position of the values underneath the circle overlay (blue data points). A 101-voxel wide sliding average smoothing was performed (red line) to reduce the influence on noise. The FWHM of the smoothed profile was used to quantitate the temporal resolution of the associated scan mode.
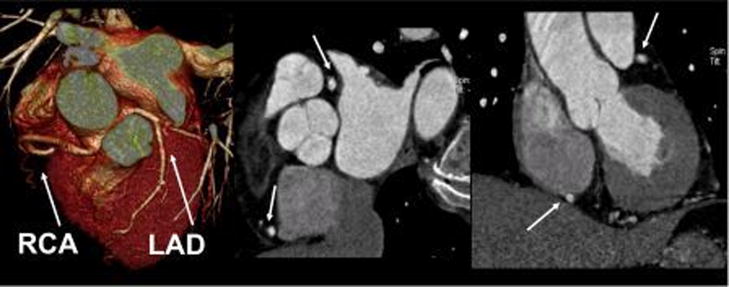
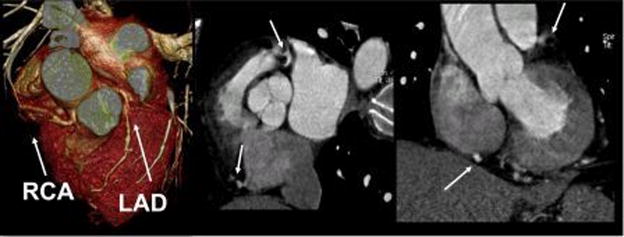
Patient data for a patient with a heart rate of 90 bpm were reconstructed using (a) tubes A and B or (b) tube A only. The 3D rendering and oblique reformatted images from patient with a mean heart rate of 90 bpm demonstrate the improved temporal resolution of the dual source technique.
Patient data for a patient with a heart rate of 90 bpm were reconstructed using (a) tubes A and B or (b) tube A only. The 3D rendering and oblique reformatted images from patient with a mean heart rate of 90 bpm demonstrate the improved temporal resolution of the dual source technique.
References
-
- Flohr TG, McCollough CH, Bruder H, Petersilka M, Gruber K, Suss C, Grasruck M, Stierstorfer K, Krauss B, Raupach R, Primak AN, Kuttner A, Achenbach S, Becker C, Kopp A, Ohnesorge BM. First performance evaluation of a dual-source CT (DSCT) system. Eur Radiol. 2006;16:256–68. - PubMed
-
- Johnson TR, Nikolaou K, Wintersperger BJ, Leber AW, von Ziegler F, Rist C, Buhmann S, Knez A, Reiser MF, Becker CR. Dual-source CT cardiac imaging: initial experience. Eur Radiol. 2006;16:1409–15. - PubMed
-
- McCollough CH, Primak AN, Saba O, Bruder H, Stierstorfer K, Raupach R, Suess C, Schmidt B, Ohnesorge BM, Flohr TG. Dose performance of a 64-channel dual-source CT scanner. Radiology. 2007;243:775–84. - PubMed
-
- Flohr TG, Stierstorfer K, Ulzheimer S, Bruder H, Primak AN, McCollough CH. Image reconstruction and image quality evaluation for a 64-slice CT scanner with z-flying focal spot. Med Phys. 2005;32:2536–47. - PubMed
-
- Flohr T, Ohnesorge B. Heart rate adaptive optimization of spatial and temporal resolution for electrocardiogram-gated multislice spiral CT of the heart. J Comput Assist Tomogr. 2001;25:907–923. - PubMed
Publication types
MeSH terms
Grants and funding
LinkOut - more resources
Full Text Sources
Other Literature Sources
Medical
