. 2008 Jun;71(4):1607-16.
doi: 10.1002/prot.22016.

Refinement of noncalorimetric determination of the change in heat capacity, DeltaC(p), of protein unfolding and validation across a wide temperature range

Affiliations

Refinement of noncalorimetric determination of the change in heat capacity, DeltaC(p), of protein unfolding and validation across a wide temperature range

Deepika Talla-Singh et al. Proteins. 2008 Jun.

Abstract

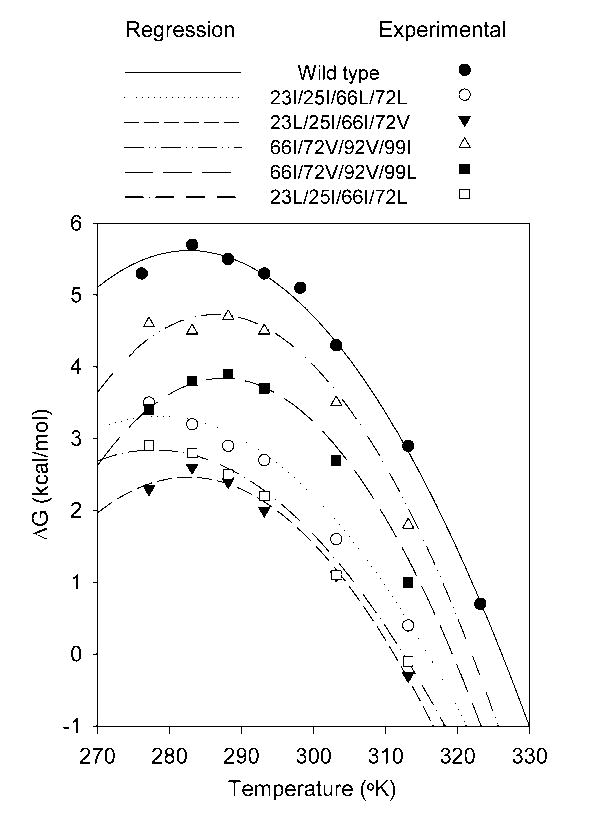
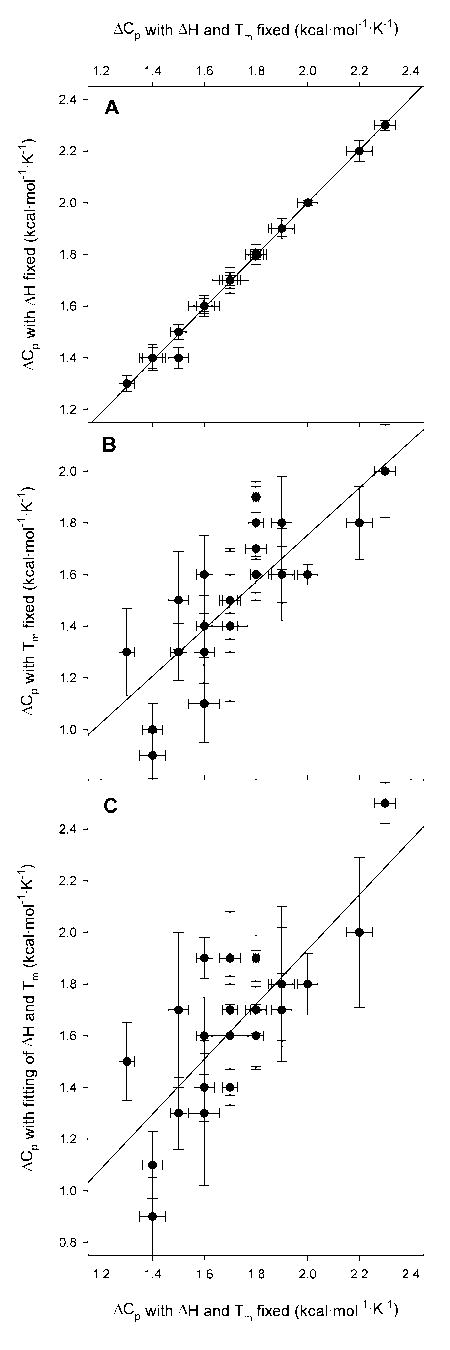
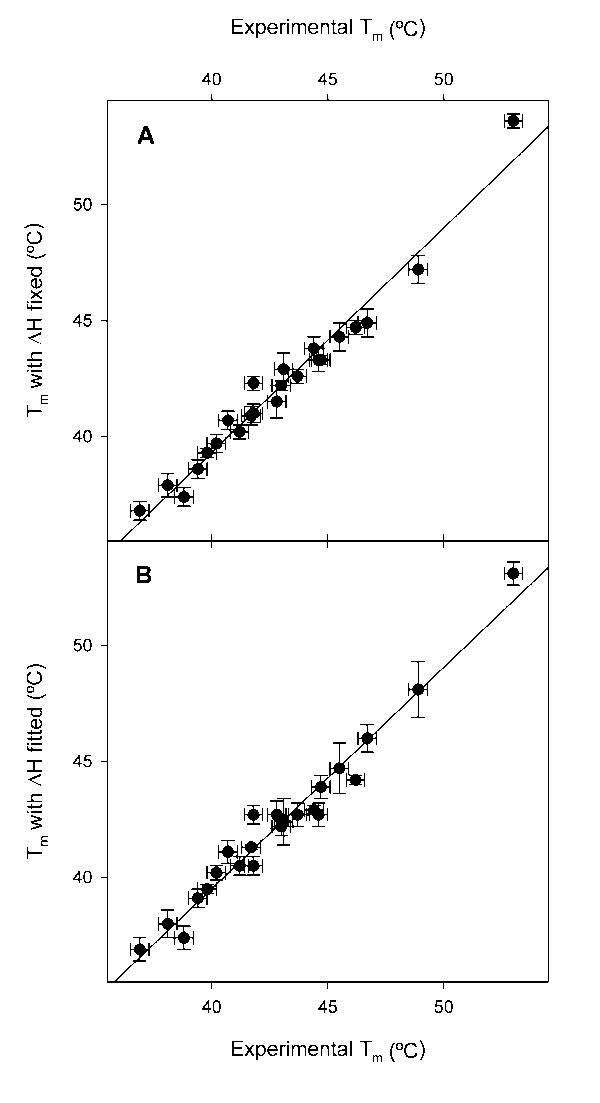
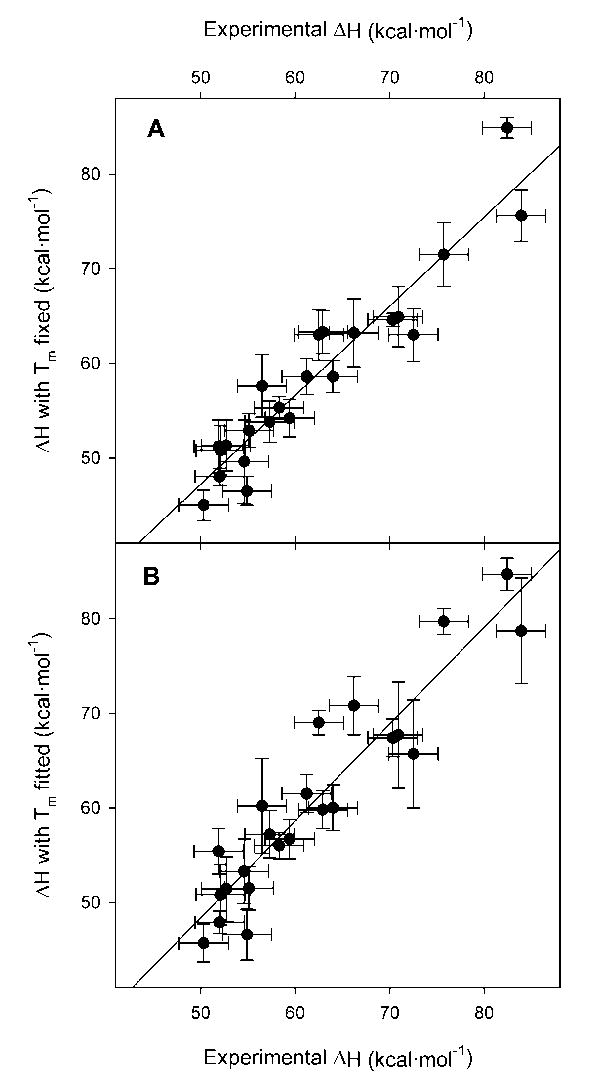
The change in heat capacity, DeltaC(p), on protein unfolding has been usually determined by calorimetry. A noncalorimetric method which employs the Gibbs-Helmholtz relationship to determine DeltaC(p) has seen some use. Generally, in this method the free energy change on unfolding of the protein is determined at a variety of temperatures and the temperature at which DeltaG is zero, T(m), and change in enthalpy at T(m) are determined by thermal denaturation and DeltaC(p) is then calculated using the Gibbs-Helmholtz equation. We show here that an abbreviated method with stability determinations at just two temperatures gives values of DeltaC(p) consistent with values from free energy change on unfolding determination at a much wider range of temperatures. Further, even the free energy change on unfolding from a single solvent denaturation at the proper temperature, when coupled with the melting temperature, T(m), and the van't Hoff enthalpy, DeltaH(vH), from a thermal denaturation, gives a reasonable estimate of DeltaC(p), albeit with greater uncertainty than solvent denaturations at two temperatures. We also find that nonlinear regression of the Gibbs-Helmholtz equation as a function of stability and temperature while simultaneously fitting DeltaC(p), T(m), and DeltaH(vH) gives values for the last two parameters that are in excellent agreement with experimental values.


Figures

Figure 1
Figure 1
Plot of ΔGH2O against temperature for wild-type staphylococcal nuclease and five representative quadruple mutants. The mutant 23I/25I/66L/72L was chosen as it has a low ΔCp and subjectively amongst the worst fits. The mutant 23L/25I/66I/72V has a markedly lower stability than wild-type, yet has a ΔCp that is nearly the same and a subjectively good fit. The mutants 66I/72V/92V/99I and 66I/72V/92V/99L are poor and good fits respectively but both with high ΔCp. The mutant 23L/25I/66I/72L has a low ΔCp and a good fit. The lines are the best fit against the Gibbs-Helmholtz equation obtained by non-linear regression of predicted ΔG against ΔGH2O for all measured temperatures while defining Tm and ΔH as the values obtained from thermal denaturation experiments. The points indicate experimental data obtained at various temperatures. The standard deviation in ΔGH2O found in repeated determinations of wild-type stability at 20°C is ± 0.1 kcal/mol.
Figure 2
Figure 2
Comparison of ΔCp values with and without fixed, experimental ΔH and Tm values. In all panels the x axis is the global ΔCp. This is the value of ΔCp obtained by fitting predicted ΔG against ΔGH2O for all measured temperatures while defining Tm and ΔH as the values obtained from thermal denaturation experiments. In panel A, the global ΔCp is plotted against the value of ΔCp returned by the regression when ΔH is fixed as the experimental value obtained from thermal denaturation and Tm is fit as well. In panel B, the global ΔCp is plotted against the value of ΔCp found by the regression when Tm is fixed as the value obtained from thermal denaturation and ΔH is now fit. In panel C, the global ΔCp is plotted against the value of ΔCp returned when ΔCp, ΔH, and Tm are all fit by non-linear regression at once. In all cases, the error bars are those given by the regression and the lines are the least square regression of ΔCp versus ΔCp.
Figure 3
Figure 3
Comparison of experimental Tm values to those derived from non-linear regression. In both panels the x axis is the experimental Tm. In panel A, the experimental Tm is plotted against the value of Tm returned by the regression when ΔH is fixed as the value obtained from thermal denaturation while ΔCp is fit as well. In panel B, the experimental Tm is plotted against the value of Tm returned when ΔCp, ΔH, and Tm are all fit by non-linear regression at once. The error bars in the y axis are those given by the regressions, the error in the x axis is the ± 0.4° standard deviation found in repeated thermal denaturations of wild-type staphylococcal nuclease. The lines are the least square regression of Tm versus Tm.
Figure 4
Figure 4
Comparison of experimental ΔH values to those derived from non-linear regression. In both panels the x axis is the experimental ΔH. In panel A, the experimental ΔH is plotted against the value of ΔH returned by the regression when Tm is fixed as the value obtained from thermal denaturation while ΔCp is fit as well. In panel B, the experimental ΔH is plotted against the value of ΔH returned when ΔCp, ΔH, and Tm are all fit simultaneously by non-linear regression. The error bars in the y axis are those given by the regressions, the error in the x axis is the ± 2.6 kcal/mol standard deviation found in repeated thermal denaturations of wild-type staphylococcal nuclease. The lines are the least square regression of ΔH versus ΔH.
Figure 5
Figure 5
Plot of ΔCp versus temperature for all 22 mutants and wild-type. Each ΔCp value is calculated from the experimental ΔH and Tm and the ΔGH2O for that protein at each temperature.
Figure 6
Figure 6
Comparison of ΔCp values calculated with ΔGH2O values determined at different temperatures and the values of ΔH and Tm from a thermal denaturation. In all panels the x axis is the global ΔCp. This is the value of ΔCp obtained by fitting predicted ΔG against ΔGH2O for all measured temperatures while defining Tm and ΔH as the values obtained from thermal denaturation experiments. In panel A, the global ΔCp is plotted against the value of ΔCp returned by the regression against just the stabilities determined at 15 and 20°C. In panel B, the global ΔCp is plotted against the value of ΔCp returned by the regression against just the stabilities determined at 20 and 30°C. In panel C, the global ΔCp is plotted against the value of ΔCp calculated from just the stability determined at 20°C. In all cases, the error bars are those given by the regression and the lines are the least square regression of ΔCp versus ΔCp.

References

    1. Pace CN, Laurents DV. A new method for determining the heat capacity change for protein folding. Biochemistry. 1989;28:2520–2525. - PubMed
    1. Pace CN, Grimsley RG, Thomas TS, Makhatadze IG. Heat capacity change for ribonuclease A folding. Protein Sci. 1999;8:1500–1504. - PMC - PubMed
    1. Schwehm JM, Stites WE. Application of automated methods for determination of protein conformational stability. Methods Enzymol. 1998;295:150–170. - PubMed
    1. Stites WE, Byrne MP, Aviv J, Kaplan M, Curtis PM. Instrumentation for automated determination of protein stability. Anal Biochem. 1995;227:112–122. - PubMed
    1. Holder JB, Bennett AF, Chen J, Spencer DS, Byrne MP, Stites WE. Energetics of side chain packing in staphylococcal nuclease assessed by exchange of valines, isoleucines, and leucines. Biochemistry. 2001;40:13998–14003. - PubMed

Publication types

LinkOut - more resources