

Changes in endoplasmic reticulum stress proteins and aldolase A in cells exposed to dopamine
- PMID: 18384645
- PMCID: PMC2767164
- DOI: 10.1111/j.1471-4159.2008.05392.x
Changes in endoplasmic reticulum stress proteins and aldolase A in cells exposed to dopamine
Abstract
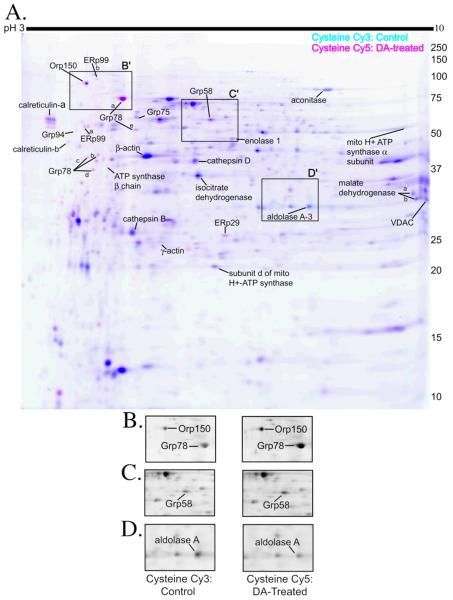
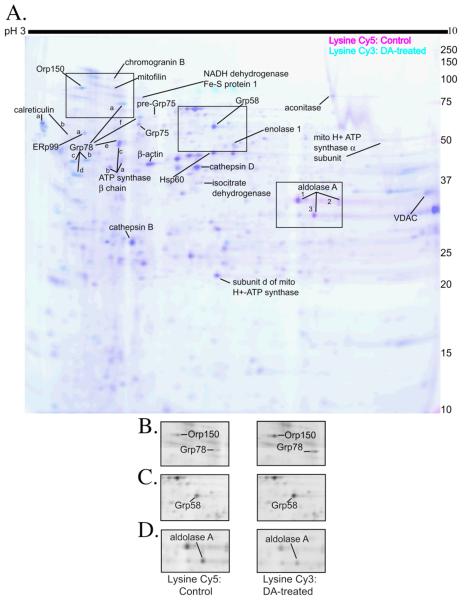
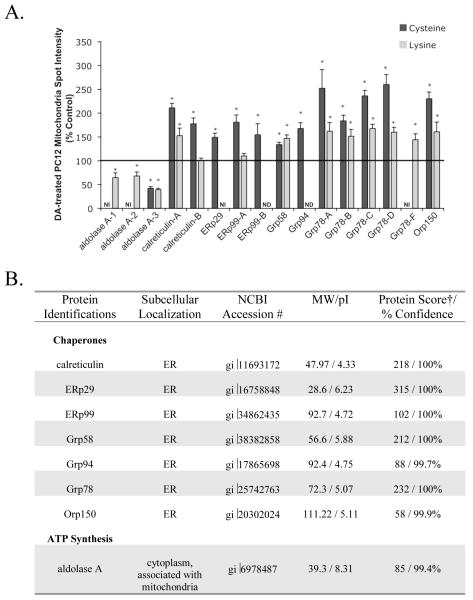
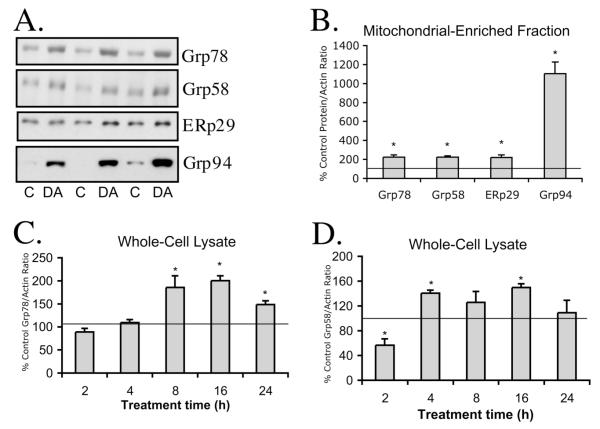
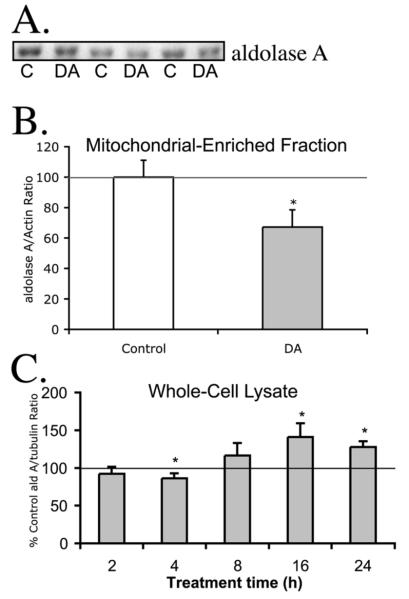
In Parkinson's disease, oxidative stress is implicated in protein misfolding and aggregation, which may activate the unfolded protein response by the endoplasmic reticulum (ER). Dopamine (DA) can initiate oxidative stress via H(2)O(2) formation by DA metabolism and by oxidation into DA quinone. We have previously shown that DA quinone induces oxidative protein modification, mitochondrial dysfunction in vitro, and dopaminergic cell toxicity in vivo and in vitro. In this study, we used cysteine- and lysine-reactive fluorescent dyes with 2D difference in-gel electrophoresis, mass spectrometry, and peptide mass fingerprint analysis to identify proteins in PC12 cell mitochondrial-enriched fractions that were altered in abundance following DA exposure (150 muM, 16 h). Quantitative changes in proteins labeled with fluorescent dyes indicated increases in a subset of proteins after DA exposure: calreticulin, ERp29, ERp99, Grp58, Grp78, Grp94 and Orp150 (149-260%), and decreased levels of aldolase A (39-42%). Changes in levels of several proteins detected by 2D difference in-gel electrophoresis were confirmed by western blot. Using this unbiased proteomics approach, our findings demonstrated that in PC12 cells, DA exposure leads to a cellular response indicative of ER stress prior to the onset of cell death, providing a potential link between DA and the unfolded protein response in the pathogenesis of Parkinson's disease.
Figures
Similar articles
-
Endoplasmic reticulum chaperones GRP78 and calreticulin prevent oxidative stress, Ca2+ disturbances, and cell death in renal epithelial cells.J Biol Chem. 1997 Aug 29;272(35):21751-9. doi: 10.1074/jbc.272.35.21751. J Biol Chem. 1997. PMID: 9268304
-
Coupling endoplasmic reticulum stress to the cell death program in dopaminergic cells: effect of paraquat.Neuromolecular Med. 2008;10(4):333-42. doi: 10.1007/s12017-008-8047-9. Epub 2008 Sep 5. Neuromolecular Med. 2008. PMID: 18773310 Free PMC article.
-
Mixed-disulfide folding intermediates between thyroglobulin and endoplasmic reticulum resident oxidoreductases ERp57 and protein disulfide isomerase.Mol Cell Biol. 2005 Nov;25(22):9793-805. doi: 10.1128/MCB.25.22.9793-9805.2005. Mol Cell Biol. 2005. PMID: 16260597 Free PMC article.
-
Calcium binding chaperones of the endoplasmic reticulum.Gen Physiol Biophys. 2009;28 Spec No Focus:F96-F103. Gen Physiol Biophys. 2009. PMID: 20093733 Review.
-
Chaperones and foldases in endoplasmic reticulum stress signaling in plants.Plant Signal Behav. 2011 Feb;6(2):232-6. doi: 10.4161/psb.6.2.15490. Epub 2011 Feb 1. Plant Signal Behav. 2011. PMID: 21427533 Free PMC article. Review.
Cited by
-
Regulation of Social Stress and Neural Degeneration by Activity-Regulated Genes and Epigenetic Mechanisms in Dopaminergic Neurons.Mol Neurobiol. 2020 Nov;57(11):4500-4510. doi: 10.1007/s12035-020-02037-7. Epub 2020 Aug 3. Mol Neurobiol. 2020. PMID: 32748368 Free PMC article. Review.
-
Mitochondrial dysfunction and oxidative stress in Parkinson's disease and monogenic parkinsonism.Neurobiol Dis. 2013 Mar;51:35-42. doi: 10.1016/j.nbd.2012.10.011. Epub 2012 Oct 12. Neurobiol Dis. 2013. PMID: 23064436 Free PMC article. Review.
-
Inhibiting ERp29 expression enhances radiosensitivity in human nasopharyngeal carcinoma cell lines.Med Oncol. 2012 Jun;29(2):721-8. doi: 10.1007/s12032-011-9929-5. Epub 2011 Apr 11. Med Oncol. 2012. PMID: 21479953
-
Endoplasmic Reticulum Protein 29 Protects Axotomized Neurons from Apoptosis and Promotes Neuronal Regeneration Associated with Erk Signal.Mol Neurobiol. 2015 Aug;52(1):522-32. doi: 10.1007/s12035-014-8840-4. Epub 2014 Sep 10. Mol Neurobiol. 2015. PMID: 25204493
-
Key genes and convergent pathogenic mechanisms in Parkinson disease.Nat Rev Neurosci. 2024 Jun;25(6):393-413. doi: 10.1038/s41583-024-00812-2. Epub 2024 Apr 10. Nat Rev Neurosci. 2024. PMID: 38600347 Review.
References
-
- Antoniou AN, Powis SJ. Characterization of the ERp57-Tapasin complex by rapid cellular acidification and thiol modification. Antioxid Redox Signal. 2003;5:375–379. - PubMed
-
- Atlante A, Calissano P, Bobba A, Giannattasio S, Marra E, Passarella S. Glutamate neurotoxicity, oxidative stress and mitochondria. FEBS Lett. 2001;497:1–5. - PubMed
-
- Beeckmans S, Van Driessche E, Kanarek L. Clustering of sequential enzymes in the glycolytic pathway and the citric acid cycle. J Cell Biochem. 1990;43:297–306. - PubMed
-
- Ben-Shachar D, Zuk R, Glinka Y. Dopamine neurotoxicity: inhibition of mitochondrial respiration. J Neurochem. 1995;64:718–723. - PubMed
-
- Berman SB, Hastings TG. Dopamine oxidation alters mitochondrial respiration and induces permeability transition in brain mitochondria: implications for Parkinson’s disease. J Neurochem. 1999;73:1127–1137. - PubMed
Publication types
MeSH terms
Substances
Grants and funding
LinkOut - more resources
Full Text Sources
Molecular Biology Databases
Research Materials
Miscellaneous
