. 2008 Jun;48(6):903-13.
doi: 10.1016/j.jhep.2008.01.030. Epub 2008 Mar 7.

Peripheral virus-specific T-cell interleukin-10 responses develop early in acute hepatitis C infection and become dominant in chronic hepatitis

Affiliations

Peripheral virus-specific T-cell interleukin-10 responses develop early in acute hepatitis C infection and become dominant in chronic hepatitis

David E Kaplan et al. J Hepatol. 2008 Jun.

Abstract

Background/aims: Interleukin-10 (IL-10) has been ascribed pro-viral but anti-fibrotic properties in chronic hepatitis C virus (HCV) infection. In this study, we examined the role of HCV-specific T-cell IL-10 response in patients with acute and chronic HCV infection.

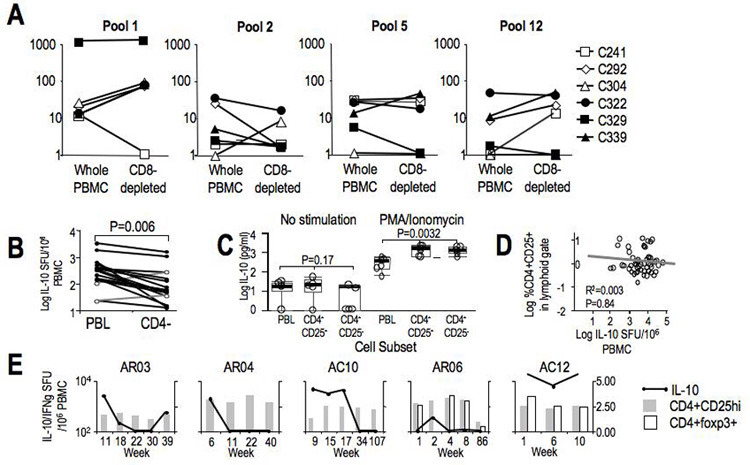
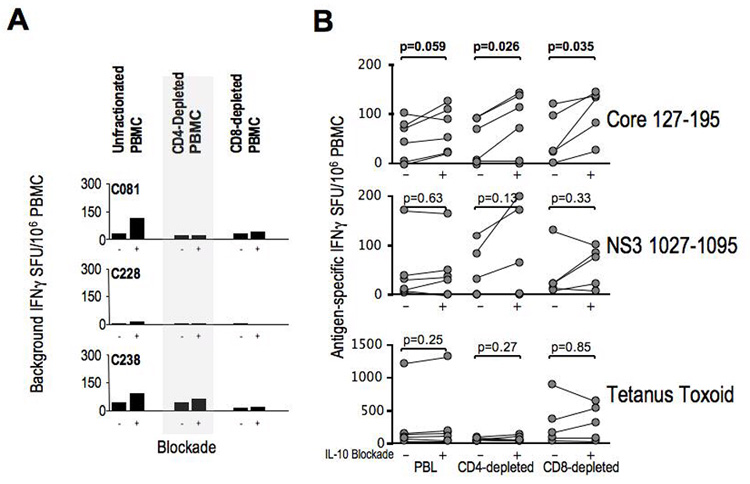
Methods: Peripheral HCV-specific T-cell IL-10 and IFNgamma responses were measured in cytokine Elispot assay using overlapping HCV-derived peptides in patients with chronic (n=61), resolved (n=15) and acute (n=8) hepatitis C, looking for their onset, quantity, breadth and durability relative to clinical and virological outcomes. The source and effect of HCV-specific IL-10 response were determined in depletion and IL-10 neutralization experiments.

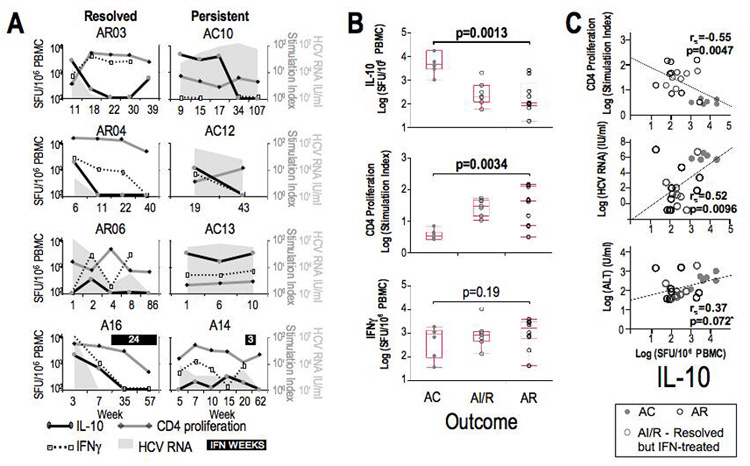
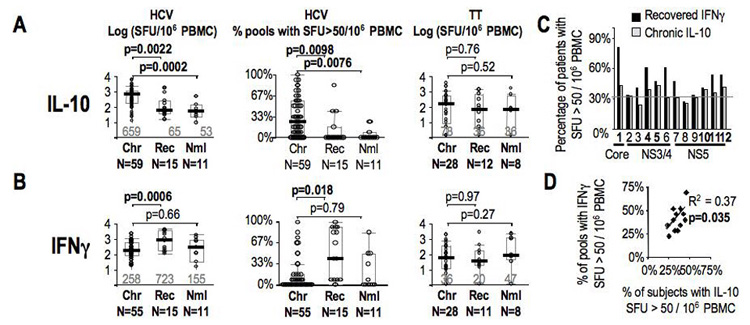
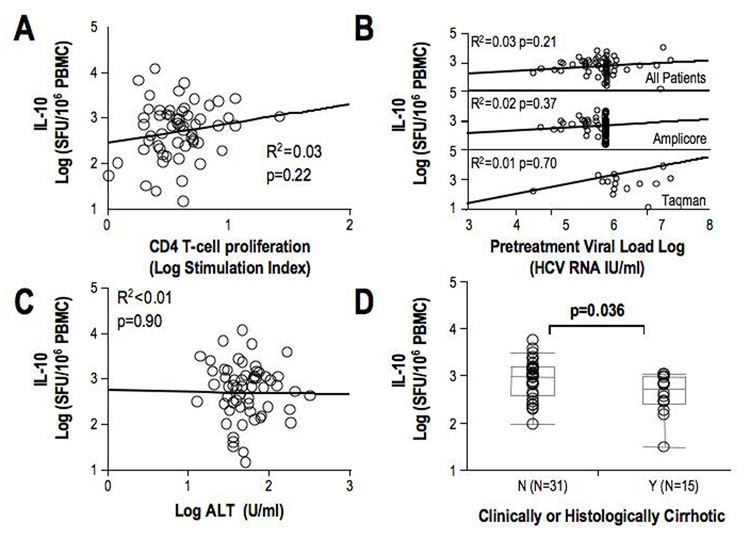
Results: Both HCV-specific IL-10 and IFNgamma responses were detected early within 1-2 months of acute clinical hepatitis C. However, only HCV-specific IL-10 response correlated with elevated liver enzymes, increased viremia and suppressed HCV-specific CD4(+) T-cell proliferation in acute infection. While these associations were lost in established chronic infection, HCV-specific IL-10 responses were increased in patients without cirrhosis while IL-10 blockade enhanced antiviral effector IFNgamma responses.

Conclusions: HCV-specific IL-10 Tr1 responses may play a dual role in HCV infection, dampening effector T-cells to promote viral persistence in acute infection but also protecting against progressive fibrosis in chronic infection.


Figures

Figure 1
Figure 1. Evolution of IL-10 responses in acute hepatitis C relative to clinical, immunological and immunophenotypical parameters
A. Temporal evolution IL-10 SFU/106 PBMC (black line), CD4 T-cell proliferation (expressed as stimulation index) (grey line) and IFNγ SFU/106 PBMC (dotted line) relative to HCV viral titer IU/ml (grey background) in 3 acute resolving (AR03, AR04, and AR06), 3 acute with chronic evolution (AC10, AC12, and AC13), and 2 acute patients who resolved but received interferon (AI/R: A14 - received only 3 PEG-IFN injections, A16 - was RNA-negative before started interferon). B. Weighted comparison of all observations within the first 24 weeks for IL-10 SFU/106 PBMC, CD4 T-cell proliferation and IFNγ SFU/106 PBMC relative to clinical outcome. P-value given for AC versus AR subjects obtained by Wilcoxon Test. C. Weighted Spearman correlations of CD4 proliferation (log stimulation index), HCV RNA titer (log IU/ml), and ALT (log U/ml) with HCV-specific IL-10 SFU/106 PBMC for all patient observations within the first 24 weeks after presentation (n=8 patients, mean 3 observations per patient). Data from AC (black circles), interferon-treated (grey circles) and AR (grey dots) are shown. Spearman rs and p-values are shown for all data. By GEE linear regression modeling, IL-10 SFU and CD4 stimulation index remained highly significant (p=0.0012), as did the association with HCV RNA titer (p=0.0108). *Exclusion of single outlier value from AR06 week 1 increased strength of correlation of IL-10 with ALT (rs=0.53, p=0.0088).
Figure 2
Figure 2. Magnitude and breadth of HCV-specific IL-10 Tr1 responses in chronic hepatitis C
A. Total HCV-specific IL-10 SFU/106 PBMC, percentage of pools with IL-10 SFU/106 PBMC > 50, and Tetanus toxoid-specific IL-10 SFU/106 PBMC by Elispot assay are shown for chronic genotype 1 HCV patients (Chr), recovered controls (Rec) and healthy donors (Nml). Median values are shown in grey with box plots indicating median (black bars), 25th and 75th percentiles. B. Total HCV-specific IFNg SFU/106 PBMC, percentage of pools with IFNγ SFU/106 PBMC > 50, and Tetanus toxoid-specific IFNγ SFU/106 PBMC by Elispot assay are shown for chronic HCV patients (Chr), recovered controls (Rec) and healthy donors (Nml). C. To demonstrate Tr1 regional response hierarchy in chronic patients relative to the effector IFNγ regional hierarchy, for each of the 12 peptide pools (annotated by region within the polyprotein), the percentage of positive IL-10 response in chronic HCV patients (N=61) (grey bars) are compared to the percentage of positive effector IFNγ responses in recovered patients (N=15)(black bars) are plotted. Grey line indicates 33%. D. Pearson correlation of chronic IL-10 and recovered IFNg responses for the 12 peptide pools showing that regional specificities of IL-10 responses in chronic patients resembles specificities for effector response in recovered subjects.
Figure 3
Figure 3. Correlation of HCV-specific IL-10 responses with immunologic, virologic and clinical parameters in chronic hepatitis C
A. Spearman correlation of HCV-specific IL-10 responses and CD4 T-cell proliferation and IFNγ responses in 59 chronic patients. B. Spearman correlation of IL-10 responses with HCV RNA titer in all chronic HCV patients using both Roche COBAS Amplicore (maximum reported value 850,000 IU/ml) and Taqman PCR (top), Amplicore only (middle) and Taqman only (bottom). C. Spearman correlation of HCV-specific IL-10 responses and ALT in 59 chronic HCV patients. D. IL-10 Tr1 responses in patients with or without cirrhosis. Cirrhosis was defined histologically (<F4/6 fibrosis, N=31 versus >F4/6 N=8) or clinically (evidence of portal hypertension or onset of decompensated cirrhosis, N=7). In 15 patients there were inadequate histological or clinical data to determine presence or absence of cirrhosis.
Figure 4
Figure 4. Cell subsets and IL-10
A. HCV-specific (to Pools 1 (Core) and 2 (NS3)), C. albicans-specific, and PHA-induced IL-10 SFU/106 PBMC in unfractionated PBMC and CD8+ T-cell-depleted PBMC in 6 chronic HCV patients. Depleted subset SFU were corrected for changes in T-cell frequency by multiplying by [%CD3PBMC}/[%CD3CD8−]. B. Summed HCV-specific IL-10 SFU/106 PBMC to 12 pools of 15mer overlapping peptides spanning Core, NS3-NS5 with unfractionated and CD4+ T-cell-depleted PBMC in 17 chronic HCV patients. C. IL-10 secretion measured by cytokine bead array (expressed in log IL-10 pg/ml) in 24 hour unstimulated and PMA/ionomycin stimulated cultures of unfractionated PBMC, bead-selected CD4+CD25+ and CD4+CD25 subsets in 5 chronic HCV patients. D. Correlation of frequency of peripheral CD4+CD25FITC+ T-cells and IL-10 SFU/106 PBMC in 59 chronic HCV patients. E. CD4+CD25hi and CD4+foxp3+ T-cell frequency in acute HCV patients. CD25+ cutoff was defined by 99.9% isotype in the lymphoid gate, while CD25hi was defined by 99.9% of CD8+ T-cells. An example of the gating strategy for CD4+CD25hi population and CD4+foxp3+ gating is shown in Supplementary Figure 1. For 3 AR and 2 AC subjects CD4+CD25hi (grey bars) and CD4+foxp3+ (white bars) are plotted relative to IL-10 SFU/106 PBMC (black line).
Figure 5
Figure 5. Effect of IL-10 blockade on IFNγ effector responses
A. Unstimulated (media-control) IFNγ SFU/106 PBMC with IL-10R blocking antibody or isotype control in PBMC, CD4-depleted and CD8-depleted PBMC subsets. 3 representative chronic HCV patients’ data shown. B. IFNγ SFU/106 PBMC after stimulation with HCV Core 127–195 15mer peptides (5uM), NS3 1027–1095 peptides (5uM) and tetanus toxoid (0.1 ug/ml) in PBMC, CD4-depleted/CD8-enriched and CD8-depleted/CD4-enriched PBMC subsets from 6 Chronic HCV subjects. To correct for the effect of IL-10 blockade on background IFNg production, mean SFU values for stimulated wells reflect subtraction of the mean SFU of unstimulated wells. P-values were obtained by matched-pair Wilcoxon sign-rank testing.

Similar articles

Cited by

References

    1. Missale G, Bertoni R, Lamonaca V, Valli A, Massari M, Mori C, et al. Different clinical behaviors of acute hepatitis C virus infection are associated with different vigor of the anti-viral cell-mediated immune response. J Clin Invest. 1996;98:706–714. - PMC - PubMed
    1. Takaki A, Wiese M, Maertens G, Depla E, Seifert U, Liebetrau A, et al. Cellular immune responses persist and humoral responses decrease two decades after recovery from a single-source outbreak of hepatitis C. Nat Med. 2000;6:578–582. - PubMed
    1. Chang KM, Thimme R, Melpolder JJ, Oldach D, Pemberton J, Moorhead-Loudis J, et al. Differential CD4(+) and CD8(+) T-cell responsiveness in hepatitis C virus infection. Hepatology. 2001;33:267–276. - PubMed
    1. Wedemeyer H, He XS, Nascimbeni M, Davis AR, Greenberg HB, Hoofnagle JH, et al. Impaired effector function of hepatitis C virus-specific CD8+ T cells in chronic hepatitis C virus infection. J Immunol. 2002;169:3447–3458. - PubMed
    1. Ulsenheimer A, Gerlach JT, Gruener NH, Jung MC, Schirren CA, Schraut W, et al. Detection of functionally altered hepatitis C virus-specific CD4 T cells in acute and chronic hepatitis C. Hepatology. 2003;37:1189–1198. - PubMed

Publication types

MeSH terms