. 2008 Mar;178(3):1709-23.
doi: 10.1534/genetics.107.080101.

Efficient control of population structure in model organism association mapping

Affiliations

Efficient control of population structure in model organism association mapping

Hyun Min Kang et al. Genetics. 2008 Mar.

Abstract

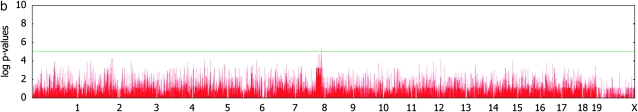
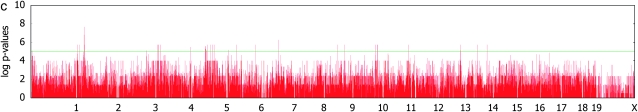
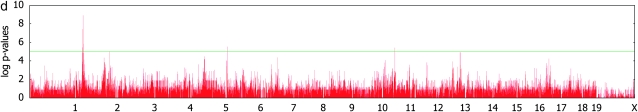
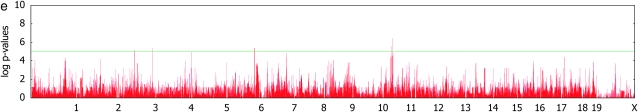
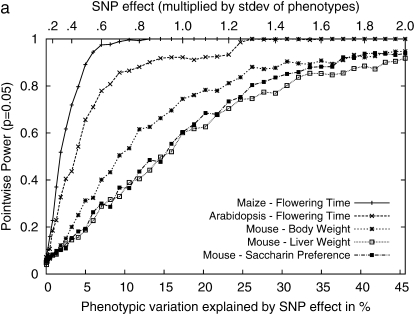
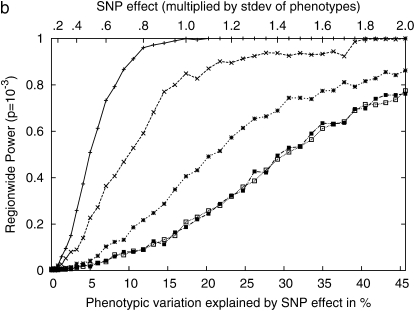
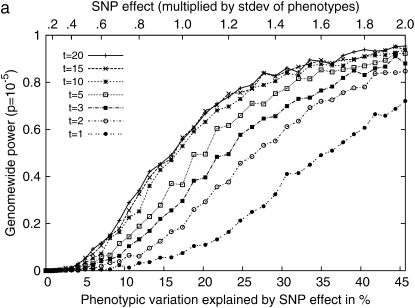
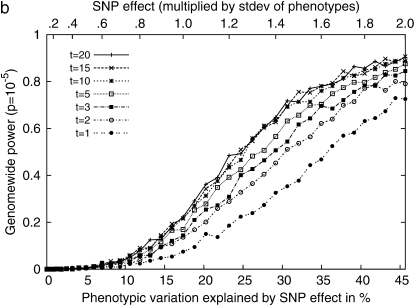
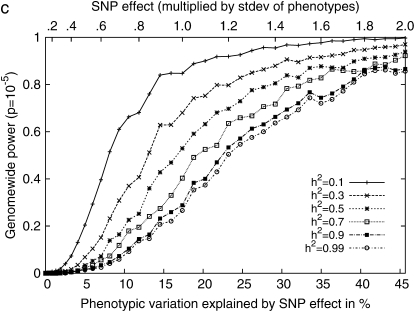
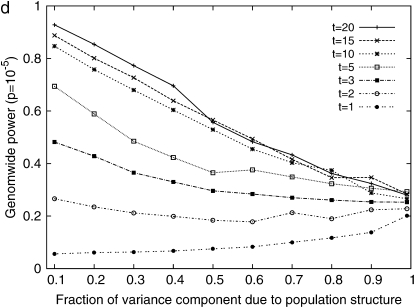
Genomewide association mapping in model organisms such as inbred mouse strains is a promising approach for the identification of risk factors related to human diseases. However, genetic association studies in inbred model organisms are confronted by the problem of complex population structure among strains. This induces inflated false positive rates, which cannot be corrected using standard approaches applied in human association studies such as genomic control or structured association. Recent studies demonstrated that mixed models successfully correct for the genetic relatedness in association mapping in maize and Arabidopsis panel data sets. However, the currently available mixed-model methods suffer from computational inefficiency. In this article, we propose a new method, efficient mixed-model association (EMMA), which corrects for population structure and genetic relatedness in model organism association mapping. Our method takes advantage of the specific nature of the optimization problem in applying mixed models for association mapping, which allows us to substantially increase the computational speed and reliability of the results. We applied EMMA to in silico whole-genome association mapping of inbred mouse strains involving hundreds of thousands of SNPs, in addition to Arabidopsis and maize data sets. We also performed extensive simulation studies to estimate the statistical power of EMMA under various SNP effects, varying degrees of population structure, and differing numbers of multiple measurements per strain. Despite the limited power of inbred mouse association mapping due to the limited number of available inbred strains, we are able to identify significantly associated SNPs, which fall into known QTL or genes identified through previous studies while avoiding an inflation of false positives. An R package implementation and webserver of our EMMA method are publicly available.


Figures

F<sc>igure</sc> 1.—
Figure 1.—
(a) Direct comparison of P-values between ASREML and EMMA, computed from 553 SNPs of maize panel data and the flowering-time phenotype using a similarity-based kinship matrix. All P-values are almost identical, implying that two methods are almost identical in terms of accuracy. One SNP in ASREML failed to converge during the variance-component estimation while it succeeded in EMMA. (b) Cumulative distribution of P-values across different models. Under the assumption that the SNPs are unlinked and there few true SNP associations, the observed P-values are expected to be close to the cumulative P-values. A large deviation from the expectation implies that the statistical test may cause spurious associations. Simple, a simple t-test; SA, structured association; MM, an F-test with a mixed model with a specified kinship matrix.
F<sc>igure</sc> 2.—
Figure 2.—
Genomewide cumulative distribution of observed P-values between (a) 13,416 Arabidopsis SNPs and flowering-time phenotypes across 95 strains using various models and(b) 106,040 mouse HapMap SNPs and three phenotypes, body weight (374 measurements over 38 strains), liver weight (304 measurements over 34 strains), and saccharin preference (280 measurements across 24 strains). S or Simple, a simple t-test; SA, structured association; MM, an F-test with a mixed model with a haplotype similarity kinship matrix; SA+MM, the unified mixed model using the output of STRUCTURE as additional fixed effects.
F<sc>igure</sc> 3.—
Figure 3.—
Genomewide scans for association with initial body weight, liver weight, and saccharin preference, using simple t-tests and F-tests with mixed models, on the basis of a kinship inferred from haplotype similarities.
F<sc>igure</sc> 3.—
Figure 3.—
Genomewide scans for association with initial body weight, liver weight, and saccharin preference, using simple t-tests and F-tests with mixed models, on the basis of a kinship inferred from haplotype similarities.
F<sc>igure</sc> 3.—
Figure 3.—
Genomewide scans for association with initial body weight, liver weight, and saccharin preference, using simple t-tests and F-tests with mixed models, on the basis of a kinship inferred from haplotype similarities.
F<sc>igure</sc> 3.—
Figure 3.—
Genomewide scans for association with initial body weight, liver weight, and saccharin preference, using simple t-tests and F-tests with mixed models, on the basis of a kinship inferred from haplotype similarities.
F<sc>igure</sc> 3.—
Figure 3.—
Genomewide scans for association with initial body weight, liver weight, and saccharin preference, using simple t-tests and F-tests with mixed models, on the basis of a kinship inferred from haplotype similarities.
F<sc>igure</sc> 4.—
Figure 4.—
Comparisons of the statistical power of the EMMA method across three different inbred mouse phenotypes and flowering time of Arabidopsis and maize, by randomly selecting causal SNPs across the genomewide SNPs. (a) Pointwise power denotes the power to identify causal SNPs at a nominal P-value of 0.05. (b) Regionwide power assumes 50 hypothetical tagSNPs in a genomic region. With 20 kb between tagSNPs, the genomic region covers up to 1 Mb. (c) Genomewide power is the power to achieve genomewide significance using the P-value threshold 10−5, which is conservative compared to the permutation-based genomewide significance thresholds using the original phenotypes. The phenotypic variation explained by SNP effect is computed assuming a minor allele frequency (MAF) of 0.3.
F<sc>igure</sc> 5.—
Figure 5.—
Comparisons of the genomewide power of the EMMA method applied to inbred mouse associations for simulated phenotypes with various SNP effects, genetic background effects, and numbers of multiple measurements. The significance threshold is P = 10−5. t is the number of multiple measurements per strain, and formula image is the fraction of the variance explained by genetic background among overall phenotypic variances when the SNP effect is not added. (a) With formula image varying β and t. (b) The same as a, using the mean phenotype value per strain instead of individual measurements. (c) With 10 multiple measurements per strain, varying β and formula image (d) With β = σ, varying t and formula image The effect of population structure is varied by changing the ratio of two variance components, and the numbers of multiple measurements are simulated with (a) 10 measurements and (b) a single measurement per strain.

References

    1. Annuciado, R. V. P., M. Nishimura, M. Mori, A. Ishikawa, S. Tanaka et al., 2001. Quantitative trait loci for body weight in the intercross between SM/J and A/J mice. Exp. Anim. 50 319–324. - PubMed
    1. Aranzana, M. J., S. Kim, K. Zhao, E. Bakker, M. Horton et al., 2005. Genome-wide association mapping in Arabidopsis identifies previously known flowering time and pathogen resistance genes. PLoS Genet. 1 e60. - PMC - PubMed
    1. Arbelbide, M., J. Yu and R. Bernado, 2006. Power of mixed-model QTL mapping from phenotypic, pedigree and marker data in self-pollinated crops. Theor. Appl. Genet. 112 876–884. - PubMed
    1. Belknap, J. K., 1998. Effect of within-strain sample size on QTL detection and mapping using recombinant inbred mouse strains. Behav. Genet. 28 29–38. - PubMed
    1. Bhattacharya, T., M. Daniels, D. Heckerman, B. Foley, N. Frahm et al., 2007. Founder effects in the assessment of HIV polymorphisms and HLA allele associations. Science 315 1583–1586. - PubMed

Publication types