

Neurodevelopmental trajectories of the human cerebral cortex
- PMID: 18385317
- PMCID: PMC6671079
- DOI: 10.1523/JNEUROSCI.5309-07.2008
Neurodevelopmental trajectories of the human cerebral cortex
Abstract
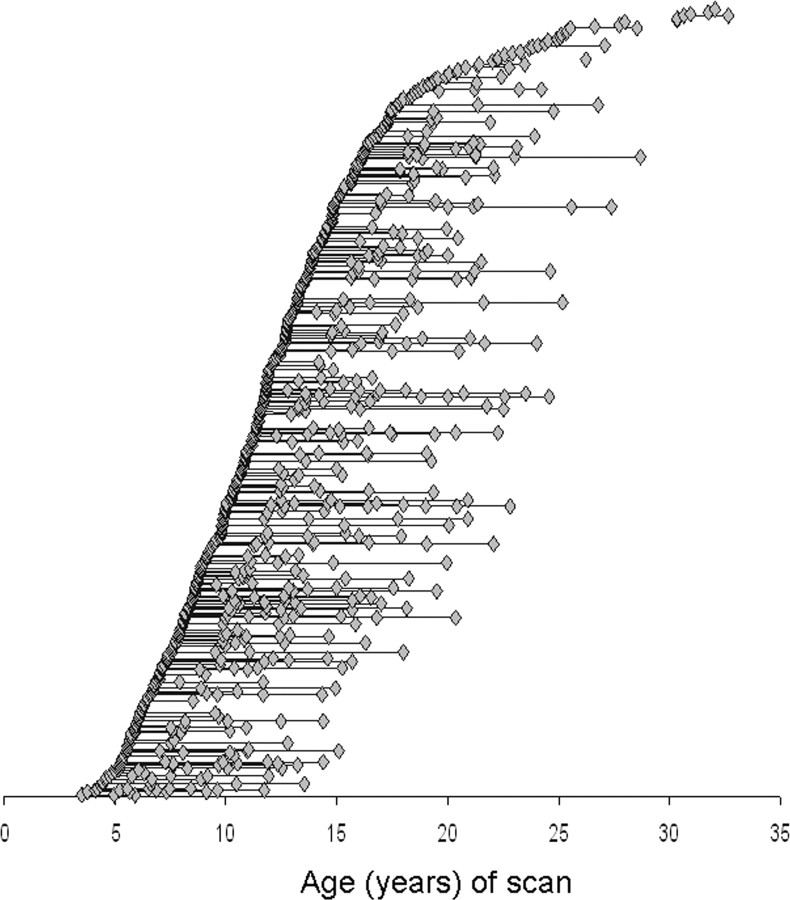
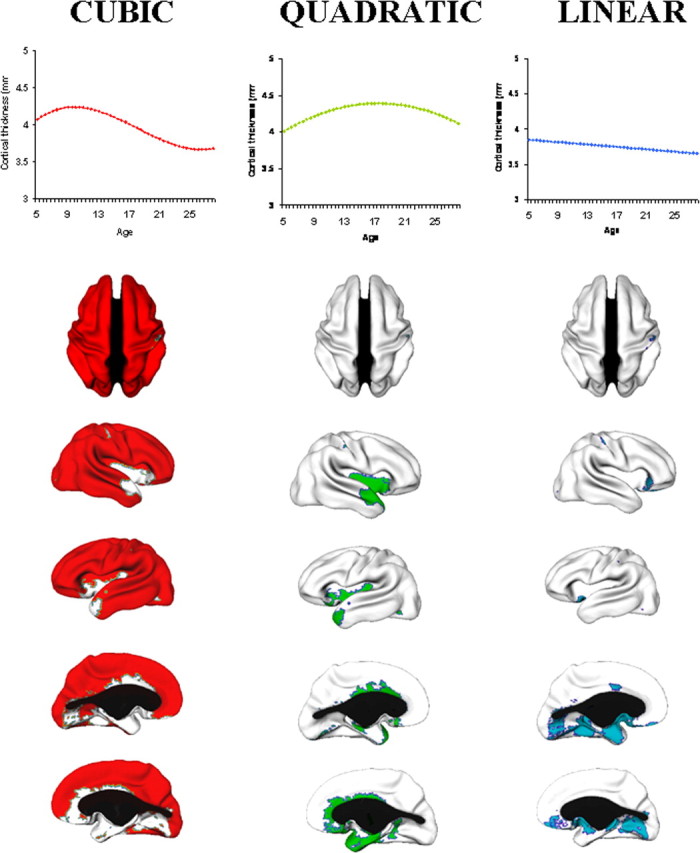
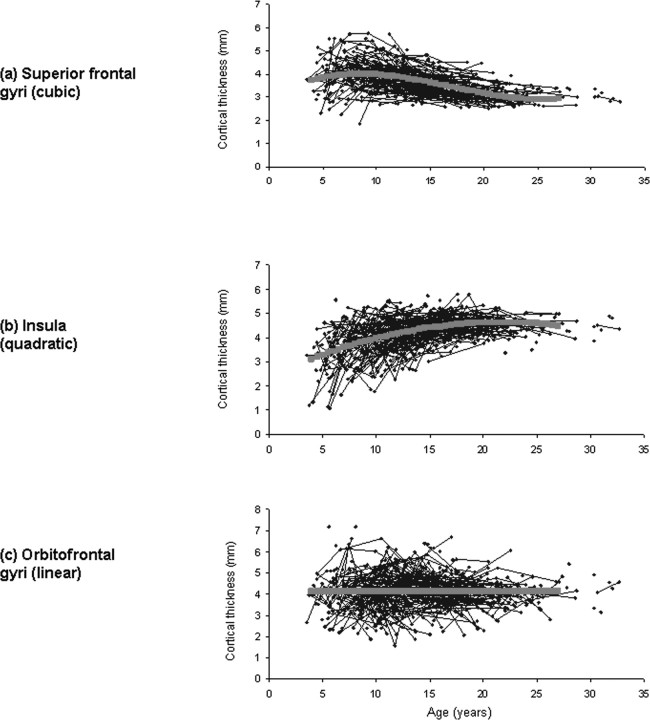
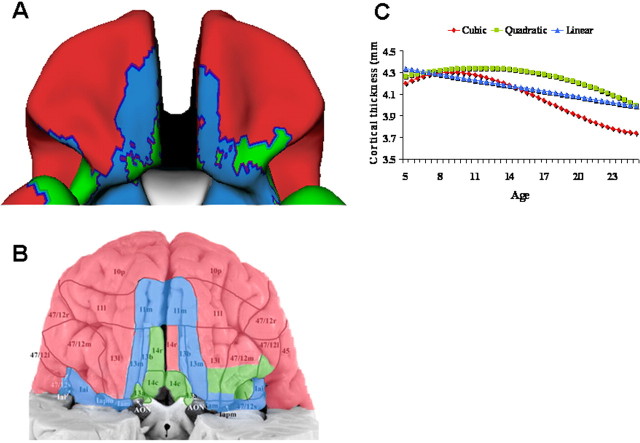
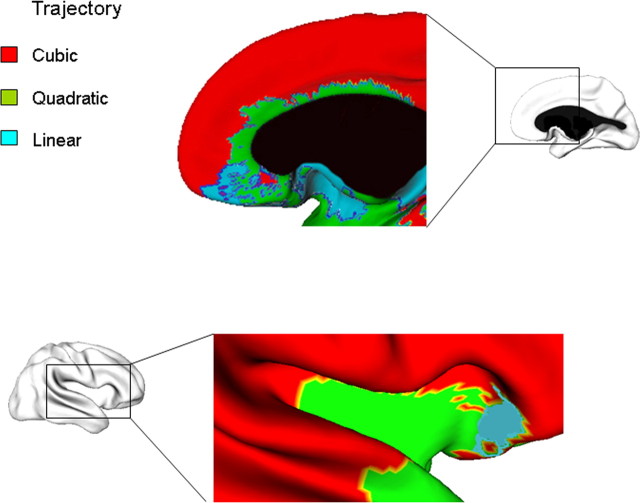
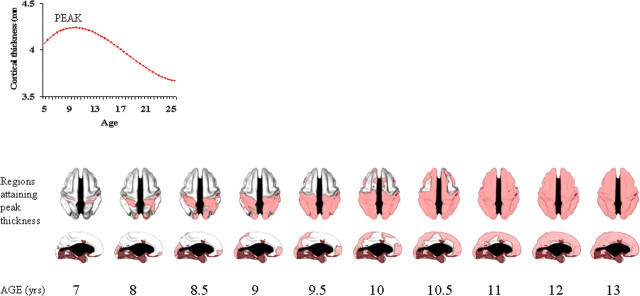
Understanding the organization of the cerebral cortex remains a central focus of neuroscience. Cortical maps have relied almost exclusively on the examination of postmortem tissue to construct structural, architectonic maps. These maps have invariably distinguished between areas with fewer discernable layers, which have a less complex overall pattern of lamination and lack an internal granular layer, and those with more complex laminar architecture. The former includes several agranular limbic areas, and the latter includes the homotypical and granular areas of association and sensory cortex. Here, we relate these traditional maps to developmental data from noninvasive neuroimaging. Changes in cortical thickness were determined in vivo from 764 neuroanatomic magnetic resonance images acquired longitudinally from 375 typically developing children and young adults. We find differing levels of complexity of cortical growth across the cerebrum, which align closely with established architectonic maps. Cortical regions with simple laminar architecture, including most limbic areas, predominantly show simpler growth trajectories. These areas have clearly identified homologues in all mammalian brains and thus likely evolved in early mammals. In contrast, polysensory and high-order association areas of cortex, the most complex areas in terms of their laminar architecture, also have the most complex developmental trajectories. Some of these areas are unique to, or dramatically expanded in primates, lending an evolutionary significance to the findings. Furthermore, by mapping a key characteristic of these development trajectories (the age of attaining peak cortical thickness) we document the dynamic, heterochronous maturation of the cerebral cortex through time lapse sequences ("movies").
Figures
References
-
- Allman J, Hakeem A, Watson K. Two phylogenetic specializations in the human brain. Neuroscientist. 2002;8:335–346. - PubMed
-
- Brockhaus H. Die cyto-und myleoarchitcktonik des crotex clastralis und des clastrum beim menschen. J Psychol Neurol. 1940;49:249–348.
-
- Brown SM, Hariri AR. Neuroimaging studies of serotonin gene polymorphisms: exploring the interplay of genes, brain, and behavior. Cogn Affect Behav Neurosci. 2006;6:44–52. - PubMed
-
- Buckholtz JW, Meyer-Lindenberg A, Honea RA, Straub RE, Pezawas L, Egan MF, Vakkalanka R, Kolachana B, Verchinski BA, Sust S, Mattay VS, Weinberger DR, Callicott JH. Allelic variation in RGS4 impacts functional and structural connectivity in the human brain. J Neurosci. 2007;27:1584–1593. - PMC - PubMed
-
- Chelune GJ, Baer RA. Developmental norms for the Wisconsin Card Sorting test. J Clin Exp Neuropsychol. 1986;8:219–228. - PubMed
Publication types
MeSH terms
Grants and funding
LinkOut - more resources
Full Text Sources
Other Literature Sources