. 2008 Apr 2;28(14):3615-22.
doi: 10.1523/JNEUROSCI.0466-08.2008.

Interneuronal activity in reflex pathways from group II muscle afferents is monitored by dorsal spinocerebellar tract neurons in the cat

Affiliations

Interneuronal activity in reflex pathways from group II muscle afferents is monitored by dorsal spinocerebellar tract neurons in the cat

Elzbieta Jankowska et al. J Neurosci. .

Abstract

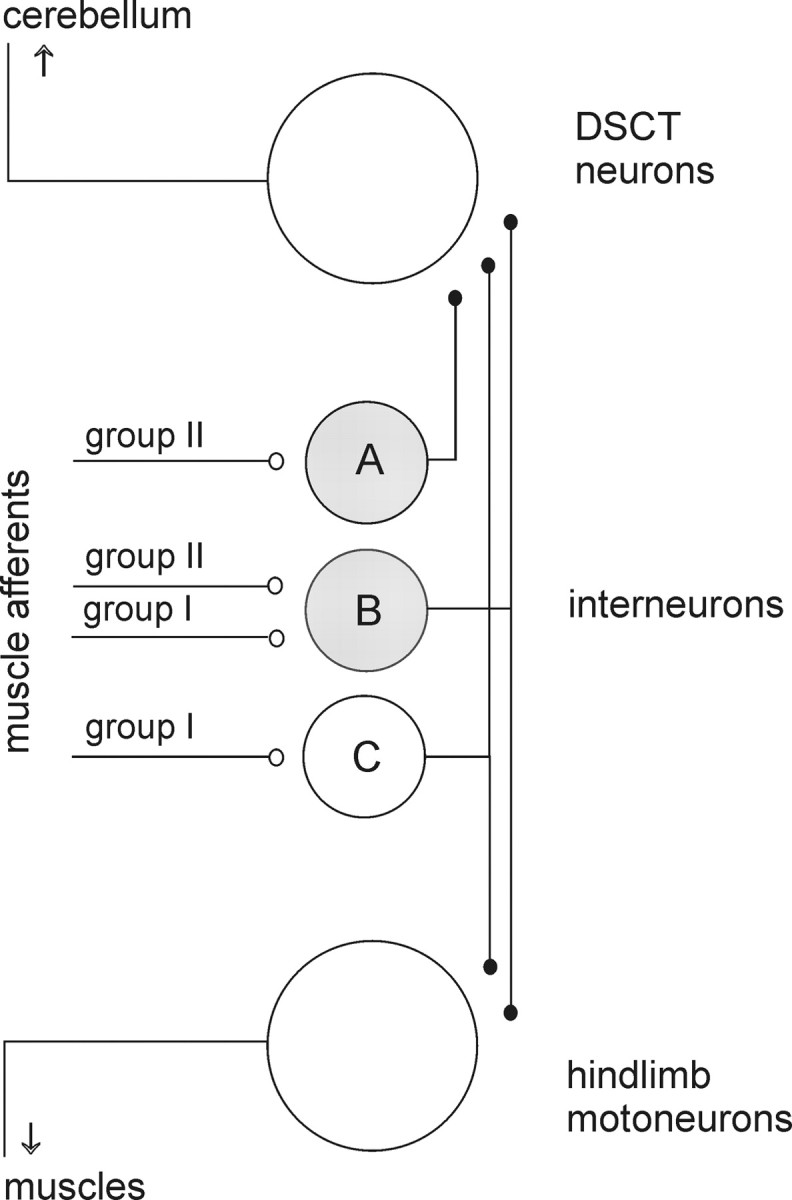
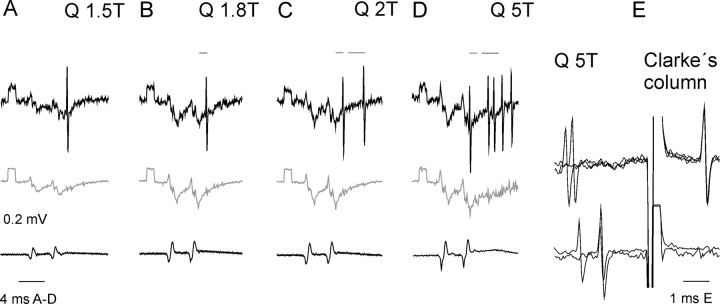
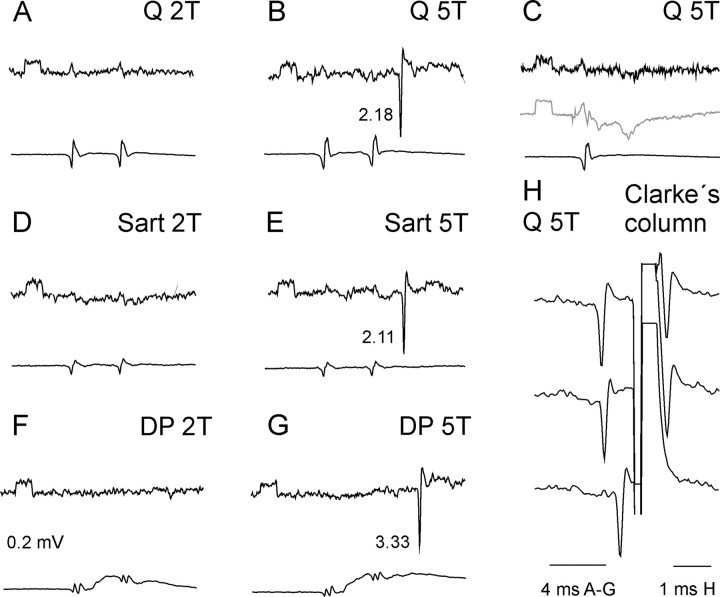
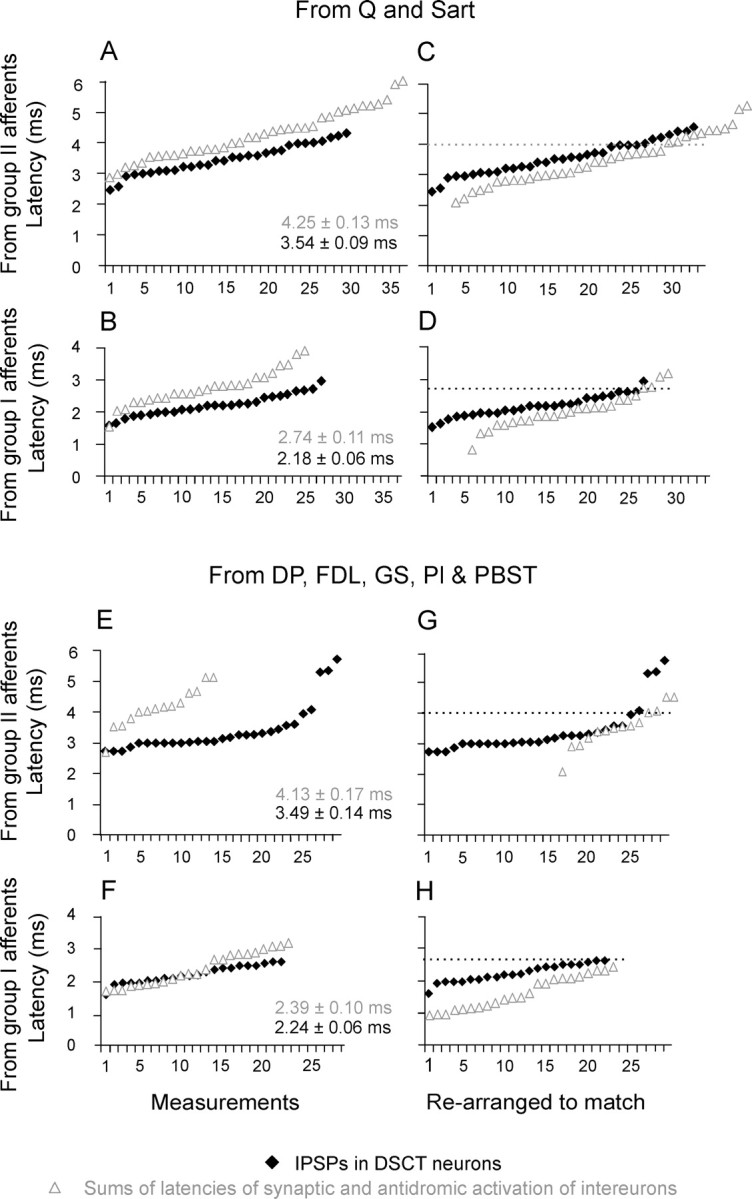
The main aim of the study was to investigate whether group II muscle afferents contribute to the inhibition of dorsal spinocerebellar tract (DSCT) neurons and thereby modulate information provided by these neurons in the cat. In intracellular recordings, we found disynaptic IPSPs from group II afferents in the majority of DSCT neurons, most often in parallel with IPSPs evoked from group I afferents. In an attempt to identify interneurons that mediate these IPSPs, the second aim of the study, laminas IV-VII in midlumbar segments were searched for interneurons antidromically activated by stimuli applied within Clarke's column. Such interneurons were found in regions in which focal field potentials were evoked by group I and II afferents, or ventral to them, and most were coexcited by these afferents. The input to these interneurons and their location indicate that they belonged to the previously identified population of premotor interneurons in disynaptic pathways between group I and II afferents and hindlimb motoneurons. The study leads thus to the conclusion that inhibitory actions of group II afferents on DSCT neurons are collateral to actions on motoneurons and that DSCT neurons monitor inhibitory actions of group II afferents on motoneurons as closely as they monitor actions of group I afferents. The results also indicate that interneurons mediating disynaptic reflex actions from tendon organ (group Ib) afferents and those mediating disynaptic actions from secondary muscle spindle (group II) afferents to motoneurons may be parts and parcel of the same interneuronal population rather than constitute distinct interneuronal populations.


Figures

Figure 1.
Figure 1.
Diagram of hypothetical coupling between group I and II muscle afferents and DSCT neurons investigated in this study. “A” and “B” denote interneurons that might mediate inhibitory actions of group II afferents on DSCT neurons. Of these, “A” represents interneurons in private pathways between group II afferents and DSCT neurons, and “B” represents interneurons in shared pathways from group I and II afferents and acting on both DSCT neurons and hindlimb α motoneurons. “C” represents interneurons in pathways from group I afferents that were shown previously to inhibit both DSCT neurons and hindlimb α motoneurons (Hongo et al., 1983a,b). The findings of this study provide evidence for the most common coupling between group II afferents and DSCT neurons via interneurons “B.”
Figure 2.
Figure 2.
Comparison of IPSPs evoked by stimuli subthreshold and near-maximal for group II afferents. Top records in each panel are intracellular records from three DSCT neurons, in A,B, C–E, and F–H, respectively. Bottom records are potentials from the surface of the spinal cord. IPSPs evoked by stimuli activating mainly group I afferents (gray) and both group I and group II afferents (black) are shown separately and superimposed on each other. Records below B and D show differences between them. Dotted lines indicate onsets of the afferent volleys and onsets of the IPSPs attributable to group I and group II afferents. The numbers to the left of the dotted lines indicate their latencies in milliseconds. E and F show antidromic spikes evoked after penetration of the neurons. Rectangular calibration pulses at the beginning of intracellular records, 0.2 mV. Voltage calibration and time calibration below H are as indicated. In this and in the following figures, the negativity in intracellular records is downward and in records from the cord dorsum is upward.
Figure 3.
Figure 3.
Comparison of latencies and peak amplitudes of IPSPs attributable to either group I or II afferents of the quadriceps, sartorius, flexor digitorum and hallucis longus, gastrocnemius-soleus, and deep peroneal nerves and pooled data for IPSPs evoked from any of these nerves. The data are derived from the DSCT neurons in which the amplitudes of IPSPs evoked by group I (A, B) and/or group II (C, D) afferents were of at least 0.1 mV and could be separated using subtraction procedures illustrated in Figure 2. The data for IPSPs recorded in additional 17 tests in which neither the latency nor amplitude of IPSPs of group I or group II origin could be measured, as of those illustrated in Figure 4, have been excluded. Dark shaded bars, Means and SEM for IPSPs evoked from the nerves indicated below B and D, with the number of IPSPs in parentheses. Lighter parts of bars in C show mean differences between latencies of IPSPs evoked from group I and II afferents in neurons in which both were evoked. No statistically significant differences were found between amplitudes of IPSPs evoked by group I and II afferents of the same nerve. No statistically significant differences were either found between effects evoked by stimulation of the same group of afferents of different nerves. Student's t test and Mann–Whitney tests gave similar results.
Figure 4.
Figure 4.
Examples of IPSPs most likely evoked by both group I and II afferents, at similar latencies but with components attributable to group II origin added with increasing stimulus intensity. Records from two DSCT neurons, in A–C and D–F, respectively, and from the surface of the spinal cord. Similar format as in Figure 2. Note that the IPSPs evoked by 5T stimuli in C and F are shown twice, either separately or together with IPSPs evoked by weaker stimuli. Note also that they grew almost continuously with stimulus intensity and that later components evoked by stronger stimuli might be distinguished in C but not in F.
Figure 5.
Figure 5.
Examples of extracellular records from an interneuron coexcited by group I and II afferents. Top traces in A–D and all those in E are single extracellular records from an interneuron located within the intermediate zone of the L4 segment (depth 2.3 mm from the surface of the spinal cord). Middle traces in A–D are 10 averaged records of field potentials, whereas bottom traces are cord dorsum potentials. A–D, Responses evoked by increasing intensities of stimulation of the Q nerve. Horizontal lines above the records in B–D indicate ranges of minimal latencies of spike potentials evoked by 1.8, 2, and 5T stimuli. E, Superimposed records in which both synaptically and antidromically evoked responses were evoked (to the left and to the right of the stimulus artifacts in the middle of the top traces, respectively) and in which the antidromic responses were collided by synaptically evoked responses induced at sufficiently short intervals.
Figure 6.
Figure 6.
Examples of extracellular records from an interneuron activated by group II afferents. Extracellular records from an interneuron located within the intermediate zone of the L4 segment (depth of 2.3 mm from the surface of the spinal cord) at a location at which field potentials from both group I and II afferents were very small. A–C, D,E, and F,G, Responses evoked by stimulation of the Q, Sart, and DP nerves, respectively. Note that the neuron was discharged by two stimuli at 5T but not at 2T nor by single stimuli at 5T. The numbers between the records in B, E, and G are the response latencies (in milliseconds) with respect to the group I afferent volleys of the effective stimulus. The middle trace in C shows average record of a field potential recorded ∼100 μm from the interneuron. H, Collision between synaptically and antidromically evoked spike potentials with stimulus artifacts truncated.
Figure 7.
Figure 7.
Comparison of latencies of IPSPs evoked in DSCT neurons and of activation of interneurons with input from group I and II afferents. Diamonds in A–D and E–H show latencies of IPSPs evoked in DSCT neurons by stimulation of the more proximal (Q and Sart) and more distal (DP, FDL, GS, PL, and PBST) nerves, from group II afferents (A, E) and from group I afferents (B, F). These have been plotted in the ascending order of latency. Dotted lines indicate upper limits of latencies of IPSPs classified with highest confidence as evoked disynaptically. Open triangles in all these plots represent sums of latencies of activation of individual interneurons by group I or II afferents and of antidromic activation of the same interneurons from Clarke's column, plotted according to the ascending order of the sums. In A,B and E,F, no corrections have been made to these sums to account for latent period of activation of axons of interneurons by electrical stimuli and other sources of their overestimation (see Results). In C,D and G,H, such corrections have been made, and the data are shifted to the right to match IPSPs mediated by later activated interneurons. For the justification of such rearrangements, see Results.

Similar articles

Cited by

References

    1. Asif M, Edgley SA. Projections of group II-activated midlumbar spinocerebellar tract neurones to the region of nucleus Z in the cat. J Physiol (Lond) 1992;448:565–578. - PMC - PubMed
    1. Bannatyne BA, Edgley SA, Hammar I, Jankowska E, Maxwell DJ. Networks of inhibitory and excitatory commissural interneurons mediating crossed reticulospinal actions. Eur J Neurosci. 2003;18:2273–2284. - PMC - PubMed
    1. Bannatyne BA, Edgley SA, Hammar I, Jankowska E, Maxwell DJ. Differential projections of excitatory and inhibitory dorsal horn interneurons relaying information from group II muscle afferents in the cat spinal cord. J Neurosci. 2006;26:2871–2880. - PMC - PubMed
    1. Bloedel JR, Courville J. Handbook of physiology. Bethesda, MD: American Physiological Society; 1981. Cerebellar afferent systems; pp. 735–829. The nervous system. Motor Control.
    1. Bosco G, Poppele RE. Proprioception from a spinocerebellar perspective. Physiol Rev. 2001;81:539–568. - PubMed

Publication types

MeSH terms

LinkOut - more resources