. 2008 Apr 2;28(14):3707-17.
doi: 10.1523/JNEUROSCI.4280-07.2008.

Intermediate progenitors in adult hippocampal neurogenesis: Tbr2 expression and coordinate regulation of neuronal output

Affiliations

Intermediate progenitors in adult hippocampal neurogenesis: Tbr2 expression and coordinate regulation of neuronal output

Rebecca D Hodge et al. J Neurosci. .

Abstract

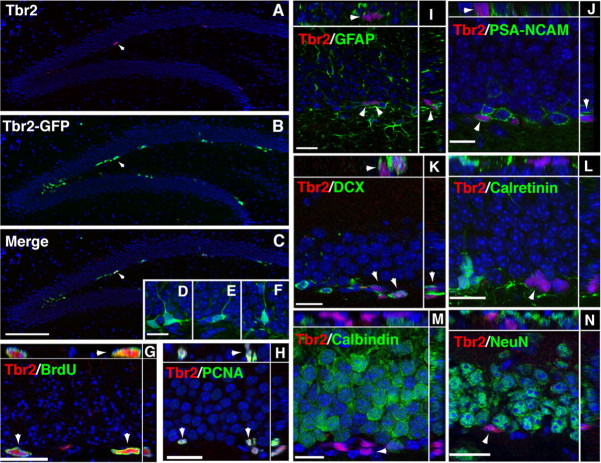
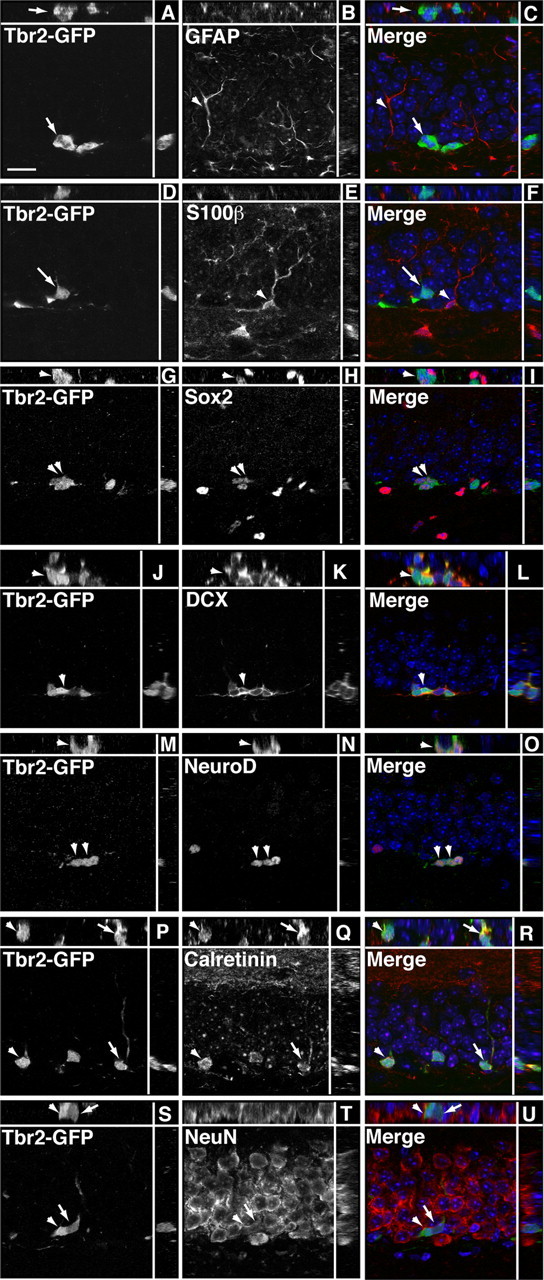
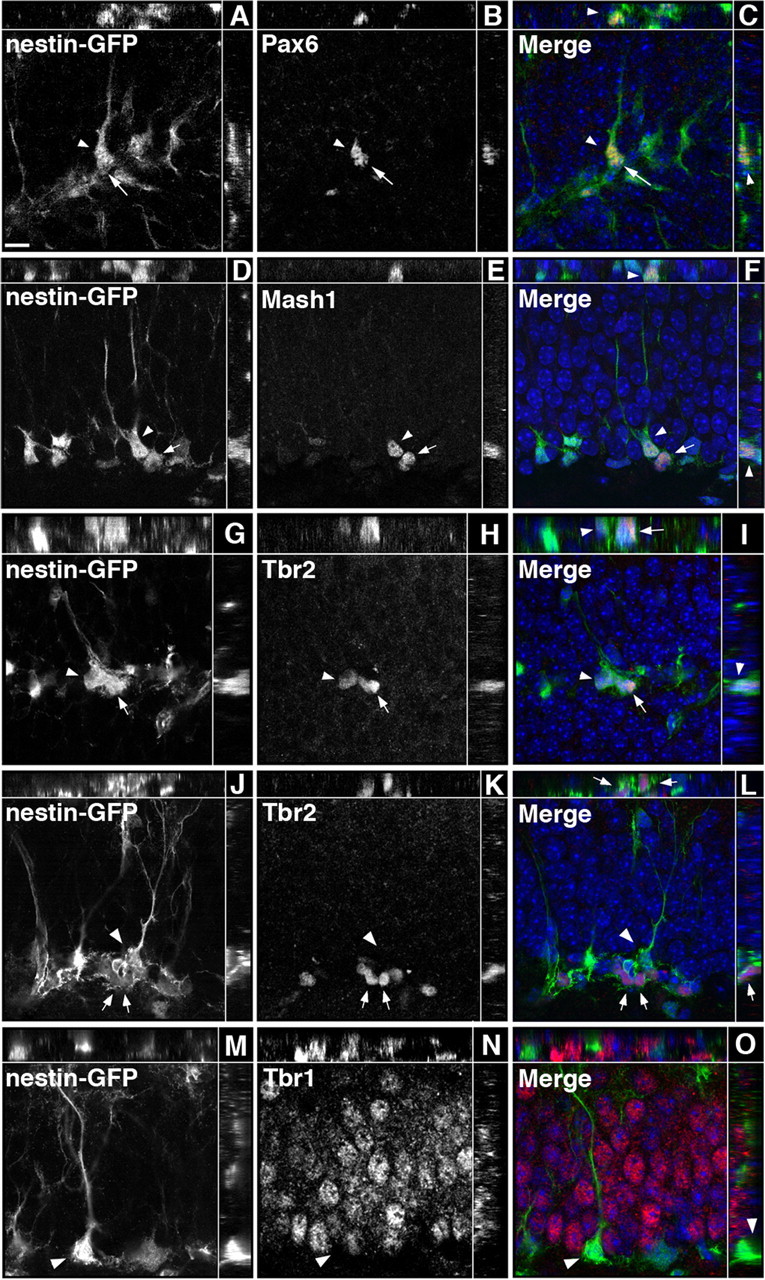
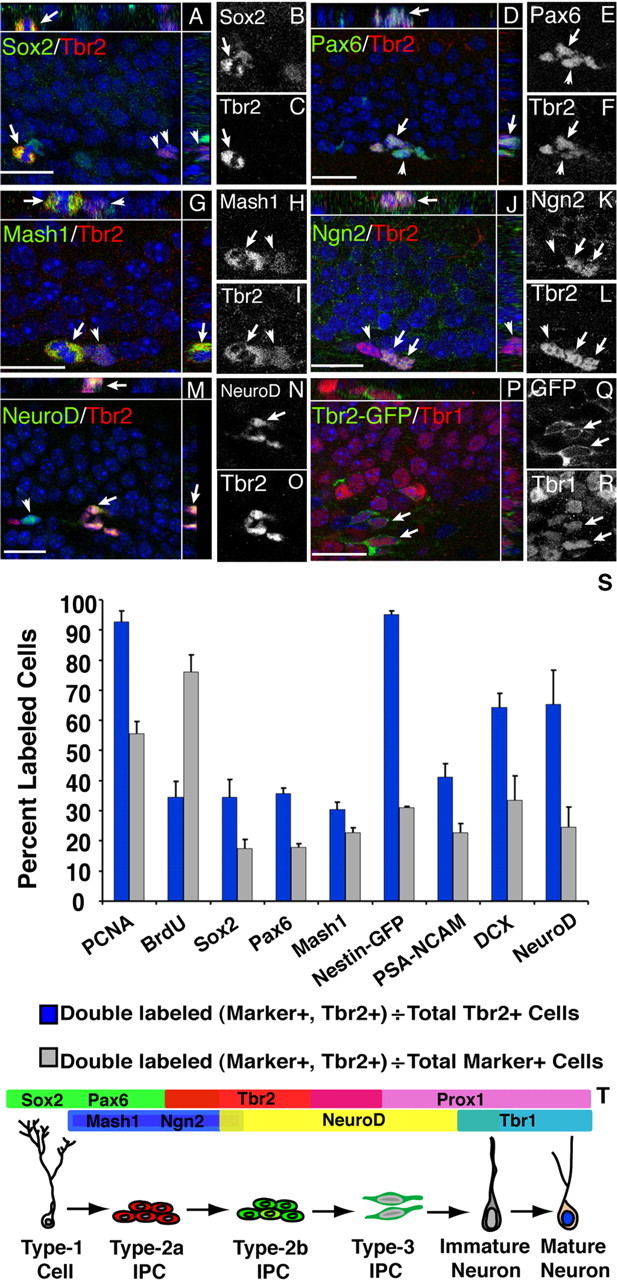
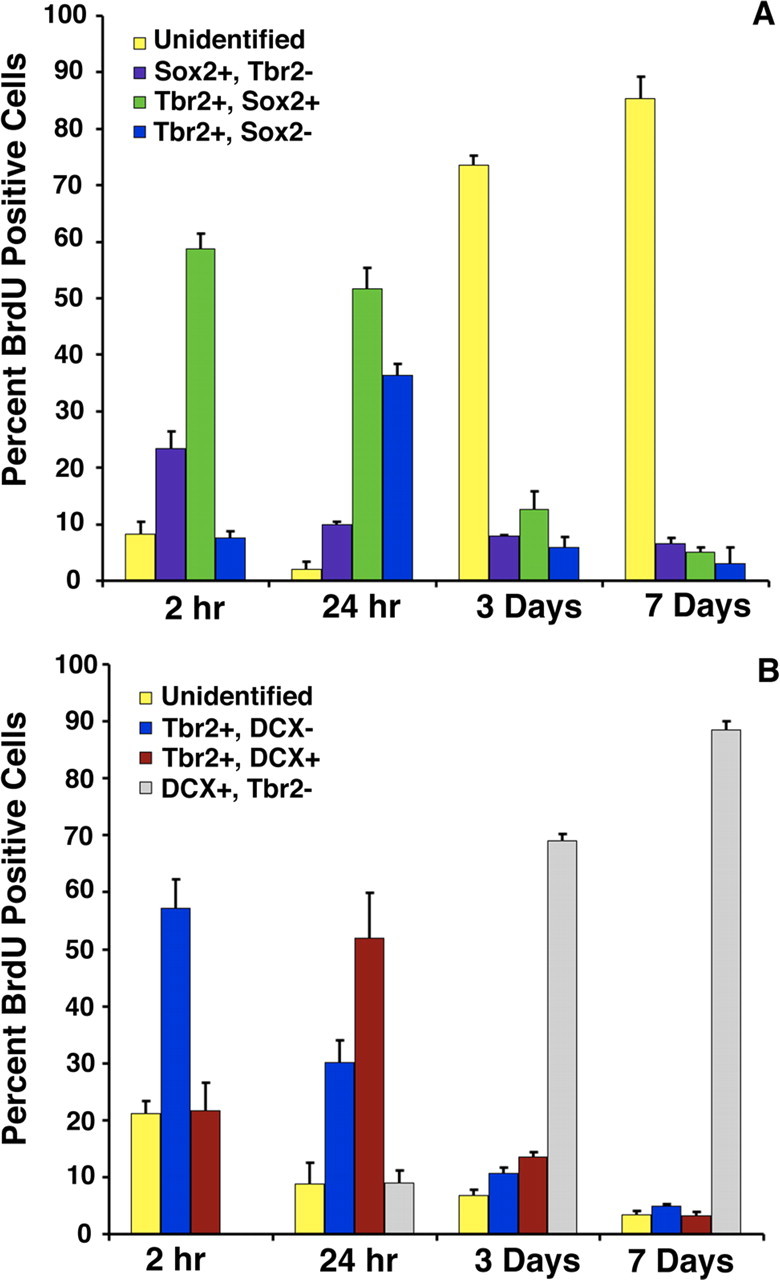
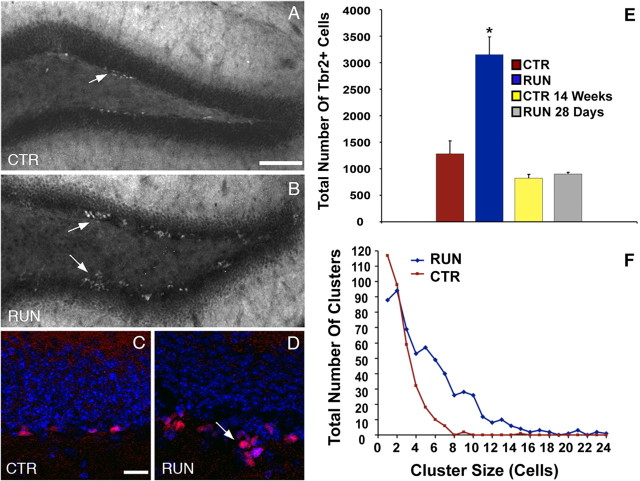
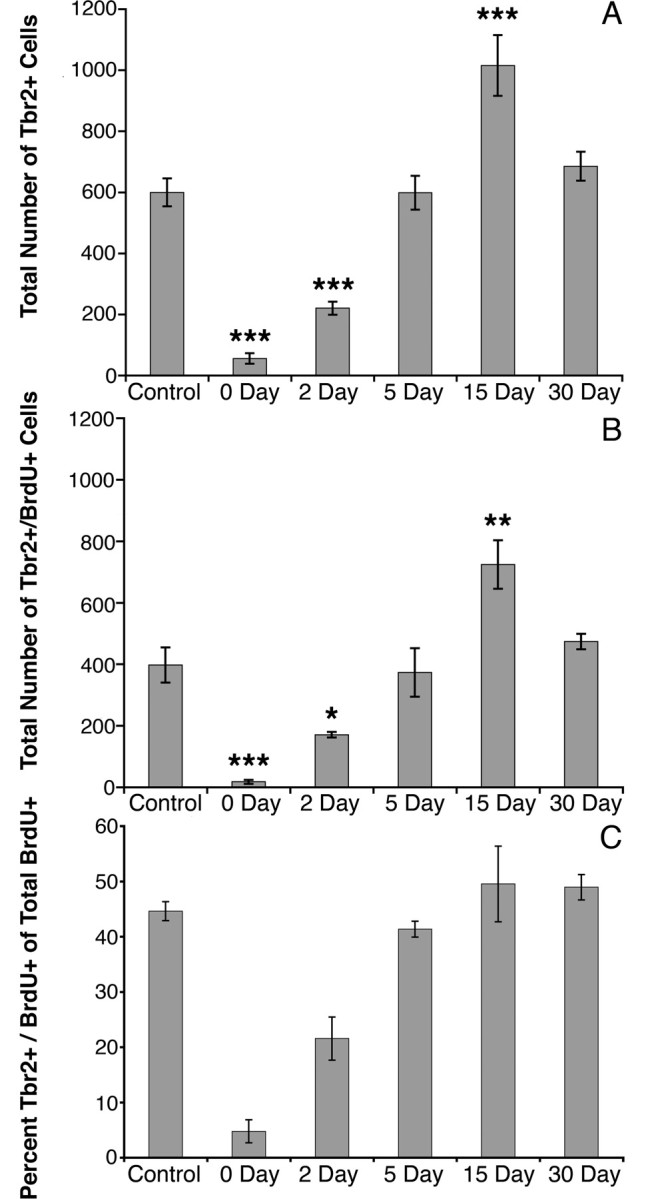
Neurogenesis in the adult hippocampus is a highly regulated process that originates from multipotent progenitors in the subgranular zone (SGZ). Currently, little is known about molecular mechanisms that regulate proliferation and differentiation in the SGZ. To study the role of transcription factors (TFs), we focused on Tbr2 (T-box brain gene 2), which has been implicated previously in developmental glutamatergic neurogenesis. In adult mouse hippocampus, Tbr2 protein and Tbr2-GFP (green fluorescent protein) transgene expression were specifically localized to intermediate-stage progenitor cells (IPCs), a type of transit amplifying cells. The Tbr2+ IPCs were highly responsive to neurogenic stimuli, more than doubling after voluntary wheel running. Notably, the Tbr2+ IPCs formed cellular clusters, the average size of which (Tbr2+ cells per cluster) likewise more than doubled in runners. Conversely, Tbr2+ IPCs were selectively depleted by antimitotic drugs, known to suppress neurogenesis. After cessation of antimitotic treatment, recovery of neurogenesis was paralleled by recovery of Tbr2+ IPCs, including a transient rebound above baseline numbers. Finally, Tbr2 was examined in the context of additional TFs that, together, define a TF cascade in embryonic neocortical neurogenesis (Pax6 --> Ngn2 --> Tbr2 --> NeuroD --> Tbr1). Remarkably, the same TF cascade was found to be linked to stages of neuronal lineage progression in adult SGZ. These results suggest that Tbr2+ IPCs play a major role in the regulation of adult hippocampal neurogenesis, and that a similar transcriptional program controls neurogenesis in adult SGZ as in embryonic cerebral cortex.


Figures

Figure 1.
Figure 1.
Tbr2 expression in the adult DG. A, Tbr2 protein was restricted to cells in the SGZ (arrowhead). B, Tbr2-GFP expression was strongest in clustered cells in the SGZ (arrowheads) and also apparent in the inner GCL. C, Merged images showed that the majority of Tbr2-positive cells also expressed Tbr2-GFP (arrowhead); however, Tbr2-GFP expression was more widespread than Tbr2 protein expression. D–F, Cells expressing Tbr2-GFP had diverse morphologies, some with tangentially oriented cell bodies typical of type-2 cells (D) and some with processes extending into the GCL similar to immature neurons (E, F). G, H, Tbr2+ cells proliferated in the SGZ as shown by colabeling with acute BrdU (G, arrowhead) and PCNA (H, arrowhead). Orthogonal views of double-labeled nuclei through the x-z and y-z axes of confocal stacks are separated by white lines in G–N. I, GFAP-positive processes were typically observed to surround Tbr2+ cells, but the cellular origin of these processes was difficult to discern (arrowheads). J, K, Tbr2+ cells colocalized with some PSA-NCAM and DCX+ cells, but expression was low in double-labeled cells (J, K, arrowheads), which were often surrounded by DCX+ or PSA-NCAM+ single-labeled cells. L, Tbr2 protein did not colocalize with calretinin. M, N, Tbr2 protein did not colocalize with either of the mature granule cell markers calbindin or NeuN. Scale bars: (in C) A–C, 100 μm; (in D) D–F, 15 μm; G, 15 μm; H–N, 20 μm.
Figure 2.
Figure 2.
Tbr2-GFP does not colocalize with glial markers, but short-term lineage tracing reveals colocalization with neuronal markers. Single-channel images are presented in gray scale. Orthogonal views are separated by white lines in each panel. A–C, Tbr2-GFP (arrow) did not clearly colocalize with GFAP (arrowhead), an astrocyte marker expressed in the processes but not cell bodies of type-1 progenitors as well as astrocytes in the GCL. D–F, Tbr2-GFP (arrow) did not colocalize with the glial marker S100β (arrowhead). G–I, Similar to Tbr2 protein expression, a small proportion of Tbr2-GFP+ cells colocalized with Sox2, an early IPC marker (arrowheads). J–L, Tbr2-GFP colocalized with a significant proportion of DCX+ cells (arrowhead). M–O, Similarly, coexpression of NeuroD, an immature granule neuron marker, was apparent in many Tbr2-GFP+ cells (arrowheads). P–R, Many Tbr2-GFP+ cells colocalized with calretinin (arrow, arrowhead), a marker of immature neurons in the DG. S–U, Some Tbr2-GFP+ cells colocalized with NeuN, which is expressed in all neuronal nuclei. Generally, Tbr2-GFP+/NeuN+ cells expressed GFP more weakly (arrow) than Tbr2-GFP+/NeuN− cells (arrowhead), suggesting that Tbr2-GFP expression is downregulated as postmitotic granule cells mature. Scale bar, 10 μm.
Figure 3.
Figure 3.
Sequential expression of TFs in nestin-GFP+ progenitors. Single-channel images are presented in grayscale. Orthogonal views are separated by the white lines in each panel. A–C, Pax6 was expressed in nestin-GFP+ cells with a clearly visible radial process typical of type-1 cells (arrowhead) and in some adjacent nestin-GFP+ type-2 cells (arrow). D–F, Mash1 was expressed in type-1 cells (arrowhead) and in some type-2 nestin-GFP+ cells (arrow). G–I, Rarely, Tbr2 was weakly expressed in type-1 progenitors (arrowhead) but was more strongly expressed in adjacent nestin-GFP+ cells with type-2 cell morphology (arrow). J–L, Nestin-GFP+/Tbr2+ cells (arrows) were commonly found in clusters next to a Tbr2-negative type-1 cell (arrowhead). M–O, Tbr1 was expressed in granule cells but did not colocalize with nestin-GFP+ progenitors (arrowhead). Scale bar, 10 μm.
Figure 4.
Figure 4.
Tbr2 is part of a TF cascade in the adult SGZ. Merged images are shown with orthogonal views separated by white lines in each panel. Single-channel images of double-labeled cells are shown in grayscale. A–C, Tbr2 colocalized with some Sox2+ cells in the SGZ, including double-labeled mitotic figures (arrow). Clusters of Sox2−/Tbr2+ cells were also apparent (arrowheads). D–F, Pax6+/Tbr2+ cell clusters were observed in the SGZ, with individual cells expressing varying levels of each TF (arrowhead). G–I, Mash1+ cells were often clustered with Tbr2+ cells, but strong coexpression occurred in only a small subset of labeled cells. Rarely, Mash1+/Tbr2+ mitotic figures were found (arrow) near strongly Tbr2+ cells that weakly expressed Mash1 (arrowhead). J–L, Clusters of Ngn2+/Tbr2+ cells (arrows) adjacent to Tbr2+/Ngn2− cells (arrowhead) were observed. M–O, NeuroD+/Tbr2+ cells were found frequently in clusters (arrow), but NeuroD expression was more widespread than Tbr2 expression, and single-labeled cells were common (arrowhead). P–R, Tbr1 was expressed in postmitotic granule cells, including some Tbr2-GFP+ cells (arrows). S, Quantification of phenotypes of Tbr2-positive cells in the SGZ. Blue bars represent the fraction of Tbr2+/marker+ cells divided by total Tbr2+ cells. Gray bars represent the fraction of Tbr2+/marker+ cells divided by total marker+ cells. Each marker is indicated on the x-axis. Error bars represent the mean ± SEM for each phenotype. T, Schematic diagram of TF expression in the DG. Scale bars, 20 μm.
Figure 5.
Figure 5.
BrdU pulse chase time series experiments. Animals were collected at survival times 2 h, 24 h, 3 d, and 7 d after administration of a single pulse of BrdU. A, Triple labeling with BrdU/Sox2/Tbr2 revealed the time course of appearance of Tbr2 in early stage IPCs (type-2a and type-2b progenitors). At early time points (2 h, 24 h), most BrdU+ cells coexpressed Tbr2 (blue bars), Sox2 (purple bars), or both Tbr2 and Sox2 (green bars). Cells labeled with only BrdU (unidentified, yellow bars) were rare at 2 and 24 h but increased in proportion at 3 and 7 d after BrdU administration. Correspondingly, Tbr2+, Sox2+, and Tbr2+/Sox2+ labeled cells decreased at the 3 and 7 d survival times. B, Triple labeling with BrdU/DCX/Tbr2 showed the time course of appearance of Tbr2 in later-stage IPCs (type-3 cells). At 2 and 24 h after BrdU administration, most BrdU+ cells expressed Tbr2 (blue bars) or both Tbr2 and DCX (red bars). At 3 and 7 d after BrdU injection, the proportions of BrdU+/Tbr2+ cells and BrdU+/DCX+/Tbr2+ cells declined, and most labeled cells were BrdU+/DCX+ (gray bars), consistent with lineage progression to postmitotic neurons at later time points. Error bars represent the mean ± SEM for each cell type in A and B.
Figure 6.
Figure 6.
Running increases Tbr2+ cells in the DG. CTR mice (A, C) exhibited visibly lower numbers of Tbr2+ cells than RUN mice (B, D). Large clusters of Tbr2+ cells extending into the hilus were apparent in RUN mice (B, D, arrows). E, Total Tbr2+ cells were increased by 2.5-fold in RUN mice (*p = 0.001) but returned to control levels (CTR, CTR 14 weeks) 28 d after running (RUN 28 d). F, RUN mice had an increased frequency of large clusters of Tbr2+ cell. In CTR mice, most Tbr2+ cells were present as single cells or doublets. In RUN mice, clusters of more than four cells were common, and very large clusters of >20 Tbr2+ cells were documented. Scale bars: A, B, 100 μm; C, D, 20 μm. Bar graphs show the mean ± SEM for each group.
Figure 7.
Figure 7.
Antimitotic drug treatment decreases Tbr2+ cells in the DG. Animals were given antimitotic drugs for 7 d and examined 0, 2, 5, 15, and 30 d after treatment. A, At 0 and 2 d posttreatment, Tbr2+ cells were significantly reduced compared with control. Tbr2+ cells reached control numbers by 5 d but surpassed controls at 15 d survival. By 30 d survival, Tbr2+ cells returned to control values. B, Counts of Tbr2+/BrdU+ progenitor cells showed the same pattern as Tbr2+ cell counts at each survival time point. C, Tbr2+/BrdU+ cells represented a small fraction of total BrdU+ cells at 0 d survival and increased thereafter. By 5 d survival, Tbr2+/BrdU+ cells reached control levels and represented a constant proportion of the total BrdU+ cell population at subsequent survival times. Bars represent the mean ± SEM for each group. *p < 0.05, **p = 0.005, ***p < 0.001.

Similar articles

Cited by

References

    1. Arlotta P, Molyneaux B, Chen J, Inoue J, Kominami R, Macklis J. Neuronal subtype-specific genes that control corticospinal motor neuron development in vivo. Neuron. 2005;45:207–221. - PubMed
    1. Britz O, Mattar P, Nguyen L, Langevin L, Zimmer C, Alam S, Guillemot F, Schuurmans C. A role for proneural genes in the maturation of cortical progenitor cells. Cereb Cortex. 2006;16:i138–i151. - PubMed
    1. Emsley J, Mitchell B, Kempermann G, Macklis J. Adult neurogenesis and repair of the adult CNS with neural progenitors, precursors, and stem cells. Prog Neurobiol. 2005;75:321–341. - PubMed
    1. Encinas J, Vaahtokari A, Enikolopov G. Fluoxetine targets early progenitor cells in the adult brain. Proc Natl Acad Sci USA. 2006;103:8233–8238. - PMC - PubMed
    1. Englund C, Fink A, Lau C, Pham D, Daza R, Bulfone A, Kowalczyk T, Hevner R. Pax6, Tbr2, and Tbr1 are expressed sequentially by radial glia, intermediate progenitor cells, and postmitotic neurons in developing neocortex. J Neurosci. 2005;25:247–251. - PMC - PubMed

Publication types

MeSH terms

LinkOut - more resources