Working memory for social cues recruits orbitofrontal cortex and amygdala: a functional magnetic resonance imaging study of delayed matching to sample for emotional expressions
- PMID: 18385330
- PMCID: PMC2748754
- DOI: 10.1523/JNEUROSCI.0464-08.2008
Working memory for social cues recruits orbitofrontal cortex and amygdala: a functional magnetic resonance imaging study of delayed matching to sample for emotional expressions
Abstract
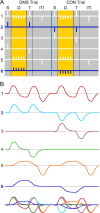
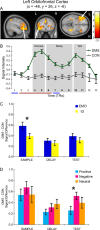
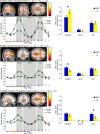
During everyday interactions, we continuously monitor and maintain information about different individuals and their changing emotions in memory. Yet to date, working memory (WM) studies have primarily focused on mechanisms for maintaining face identity, but not emotional expression, and studies investigating the neural basis of emotion have focused on transient activity, not delay related activity. The goal of this functional magnetic resonance imaging study was to investigate WM for two critical social cues: identity and emotion. Subjects performed a delayed match-to-sample task that required them to match either the emotional expression or the identity of a face after a 10 s delay. Neuroanatomically, our predictions focused on the orbitofrontal cortex (OFC) and the amygdala, as these regions have previously been implicated in emotional processing and long-term memory, and studies have demonstrated sustained OFC and medial temporal lobe activity during visual WM. Consistent with previous studies, transient activity during the sample period representing emotion and identity was found in the superior temporal sulcus and inferior occipital cortex, respectively. Sustained delay-period activity was evident in OFC, amygdala, and hippocampus, for both emotion and identity trials. These results suggest that, although initial processing of emotion and identity is accomplished in anatomically segregated temporal and occipital regions, sustained delay related memory for these two critical features is held by the OFC, amygdala and hippocampus. These regions share rich connections, and have been shown previously to be necessary for binding features together in long-term memory. Our results suggest a role for these regions in active maintenance as well.
Figures


Similar articles
-
Role of the hippocampus and orbitofrontal cortex during the disambiguation of social cues in working memory.Cogn Affect Behav Neurosci. 2013 Dec;13(4):900-15. doi: 10.3758/s13415-013-0170-x. Cogn Affect Behav Neurosci. 2013. PMID: 23640112 Free PMC article.
-
Specific and nonspecific neural activity during selective processing of visual representations in working memory.J Cogn Neurosci. 2010 Feb;22(2):292-306. doi: 10.1162/jocn.2009.21250. J Cogn Neurosci. 2010. PMID: 19400681
-
Delayed match to object or place: an event-related fMRI study of short-term stimulus maintenance and the role of stimulus pre-exposure.Neuroimage. 2008 Jan 15;39(2):857-72. doi: 10.1016/j.neuroimage.2007.09.023. Epub 2007 Sep 21. Neuroimage. 2008. PMID: 17950623 Free PMC article.
-
Distributed and interactive brain mechanisms during emotion face perception: evidence from functional neuroimaging.Neuropsychologia. 2007 Jan 7;45(1):174-94. doi: 10.1016/j.neuropsychologia.2006.06.003. Epub 2006 Jul 18. Neuropsychologia. 2007. PMID: 16854439 Review.
-
Retrieval of emotional memories.Psychol Bull. 2007 Sep;133(5):761-79. doi: 10.1037/0033-2909.133.5.761. Psychol Bull. 2007. PMID: 17723029 Free PMC article. Review.
Cited by
-
Maintenance of Bodily Expressions Modulates Functional Connectivity Between Prefrontal Cortex and Extrastriate Body Area During Working Memory Processing.Brain Sci. 2024 Nov 22;14(12):1172. doi: 10.3390/brainsci14121172. Brain Sci. 2024. PMID: 39766371 Free PMC article.
-
Encoding of gustatory working memory by orbitofrontal neurons.J Neurosci. 2009 Jan 21;29(3):765-74. doi: 10.1523/JNEUROSCI.4637-08.2009. J Neurosci. 2009. PMID: 19158302 Free PMC article.
-
Memory retrieval of smoking-related images induce greater insula activation as revealed by an fMRI-based delayed matching to sample task.Addict Biol. 2015 Mar;20(2):349-56. doi: 10.1111/adb.12112. Epub 2013 Nov 22. Addict Biol. 2015. PMID: 24261848 Free PMC article.
-
Individual differences in neural activity during a facial expression vs. identity working memory task.Neuroimage. 2011 Jun 1;56(3):1685-92. doi: 10.1016/j.neuroimage.2011.02.051. Epub 2011 Feb 22. Neuroimage. 2011. PMID: 21349341 Free PMC article.
-
Working memory deficits in high-functioning adolescents with autism spectrum disorders: neuropsychological and neuroimaging correlates.J Neurodev Disord. 2013 Jun 4;5(1):14. doi: 10.1186/1866-1955-5-14. J Neurodev Disord. 2013. PMID: 23731472 Free PMC article.
References
-
- Adolphs R, Tranel D. Amygdala damage impairs emotion recognition from scenes only when they contain facial expressions. Neuropsychologia. 2003;41:1281–1289. - PubMed
-
- Adolphs R, Baron-Cohen S, Tranel D. Impaired recognition of social emotions following amygdala damage. J Cogn Neurosci. 2002;14:1264–1274. - PubMed
-
- Andrews TJ, Ewbank MP. Distinct representations for facial identity and changeable aspects of faces in the human temporal lobe. NeuroImage. 2004;23:905–913. - PubMed
-
- Barbas H. Anatomic organization of basoventral and mediodorsal visual recipient prefrontal regions in the rhesus monkey. J Comp Neurol. 1988;276:313–342. - PubMed
-
- Barbas H. Connections underlying the synthesis of cognition, memory, and emotion in primate prefrontal cortices. Brain Res Bull. 2000;52:319–330. - PubMed
Publication types
MeSH terms
Substances
Grants and funding
LinkOut - more resources
Full Text Sources
