

The thermal impulse response of Escherichia coli
- PMID: 18385380
- PMCID: PMC2291076
- DOI: 10.1073/pnas.0709903105
The thermal impulse response of Escherichia coli
Abstract
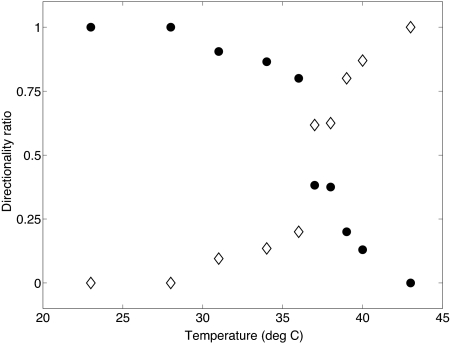
Swimming Escherichia coli responds to changes in temperature by modifying its motor behavior. Previous studies using populations of cells have shown that E. coli accumulate in spatial thermal gradients, but these experiments did not cleanly separate thermal responses from chemotactic responses. Here we have isolated the thermal response by studying the behavior of single, tethered cells. The motor output of cells grown at 33 degrees C was measured at constant temperature, from 10 degrees to 40 degrees C, and in response to small, impulsive increases in temperature, from 23 degrees to 43 degrees C. The thermal impulse response at temperatures < 31 degrees C is similar to the chemotactic impulse response: Both follow a similar time course, share the same directionality, and show biphasic characteristics. At temperatures > 31 degrees C, some cells show an inverted response, switching from warm- to cold-seeking behavior. The fraction of inverted responses increases nonlinearly with temperature, switching steeply at the preferred temperature of 37 degrees C.
Conflict of interest statement
The authors declare no conflict of interest.
Figures


Similar articles
-
Thermosensing ability of Trg and Tap chemoreceptors in Escherichia coli.J Bacteriol. 1991 Feb;173(3):1120-4. doi: 10.1128/jb.173.3.1120-1124.1991. J Bacteriol. 1991. PMID: 1991711 Free PMC article.
-
Temperature-induced switching of the bacterial flagellar motor.Biophys J. 1996 Oct;71(4):2227-33. doi: 10.1016/S0006-3495(96)79425-0. Biophys J. 1996. PMID: 8889199 Free PMC article.
-
Response kinetics of tethered Rhodobacter sphaeroides to changes in light intensity.Biophys J. 2000 Mar;78(3):1207-15. doi: 10.1016/S0006-3495(00)76678-1. Biophys J. 2000. PMID: 10692310 Free PMC article.
-
The rotary motor of bacterial flagella.Annu Rev Biochem. 2003;72:19-54. doi: 10.1146/annurev.biochem.72.121801.161737. Epub 2002 Dec 11. Annu Rev Biochem. 2003. PMID: 12500982 Review.
-
The bacterial flagellar motor.Annu Rev Biophys Biomol Struct. 1994;23:509-39. doi: 10.1146/annurev.bb.23.060194.002453. Annu Rev Biophys Biomol Struct. 1994. PMID: 7919791 Review. No abstract available.
Cited by
-
Noninvasive inference of the molecular chemotactic response using bacterial trajectories.Proc Natl Acad Sci U S A. 2012 Jan 31;109(5):1802-7. doi: 10.1073/pnas.1116772109. Epub 2012 Jan 17. Proc Natl Acad Sci U S A. 2012. PMID: 22307649 Free PMC article.
-
Bacterial motility measured by a miniature chamber for high-pressure microscopy.Int J Mol Sci. 2012;13(7):9225-9239. doi: 10.3390/ijms13079225. Epub 2012 Jul 24. Int J Mol Sci. 2012. PMID: 22942763 Free PMC article.
-
Data-driven statistical modeling of the emergent behavior of biohybrid microrobots.APL Bioeng. 2020 Feb 28;4(1):016104. doi: 10.1063/1.5134926. eCollection 2020 Mar. APL Bioeng. 2020. PMID: 32128471 Free PMC article.
-
Vertebrate behavioral thermoregulation: knowledge and future directions.Neurophotonics. 2024 Jul;11(3):033409. doi: 10.1117/1.NPh.11.3.033409. Epub 2024 May 20. Neurophotonics. 2024. PMID: 38769950 Free PMC article. Review.
-
Bacterial strategies for chemotaxis response.Proc Natl Acad Sci U S A. 2010 Jan 26;107(4):1391-6. doi: 10.1073/pnas.0909673107. Epub 2010 Jan 4. Proc Natl Acad Sci U S A. 2010. PMID: 20080704 Free PMC article.
References
-
- Salman H, Zilman A, Loverdo C, Jeffroy M, Libchaber A. Solitary modes of bacterial culture in a temperature gradient. Phys Rev Lett. 2006;97:118101. - PubMed
-
- Berg HC. E. coli in Motion. New York: Springer; 2004.
-
- Nara T, Kawagishi I, Nishiyama S, Homma M, Imae Y. Modulation of the thermosensing profile of the Escherichia coli aspartate receptor tar by covalent modification of its methyl-accepting sites. J Biol Chem. 1996;271:17932–17936. - PubMed
-
- Salman H, Libchaber A. A concentration-dependent switch in the bacterial response to temperature. Nat Cell Biol. 2007;9:1098–1100. - PubMed
Publication types
MeSH terms
Grants and funding
LinkOut - more resources
Full Text Sources
