. 2008 Jul;19(7):1360-70.
doi: 10.1681/ASN.2007080901. Epub 2008 Apr 2.

Acute kidney injury leads to inflammation and functional changes in the brain

Affiliations

Acute kidney injury leads to inflammation and functional changes in the brain

Manchang Liu et al. J Am Soc Nephrol. 2008 Jul.

Abstract

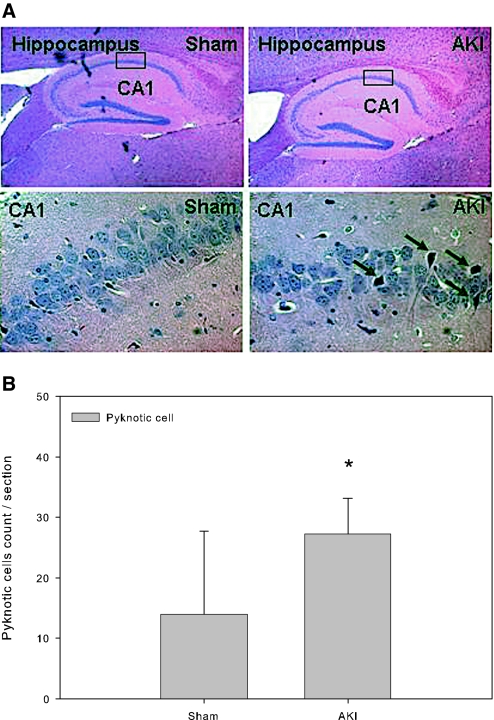
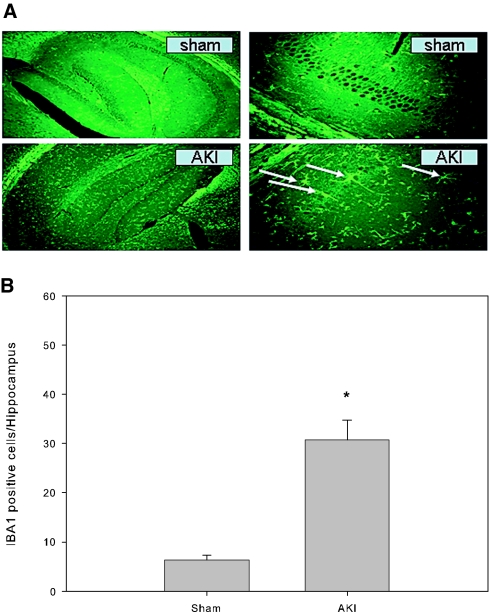
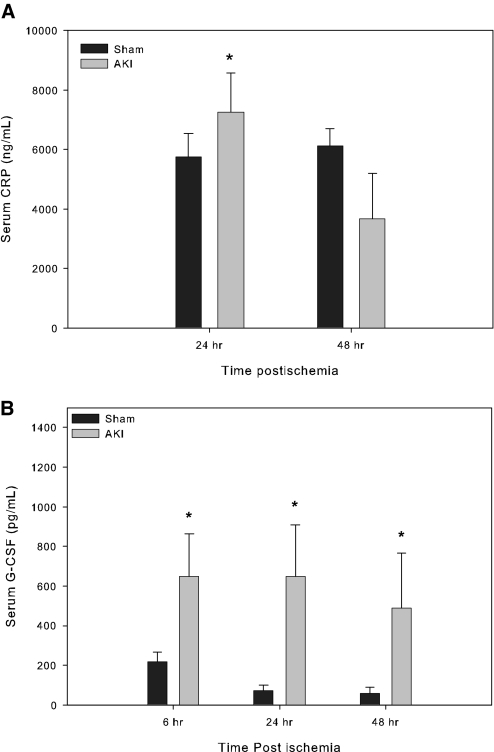
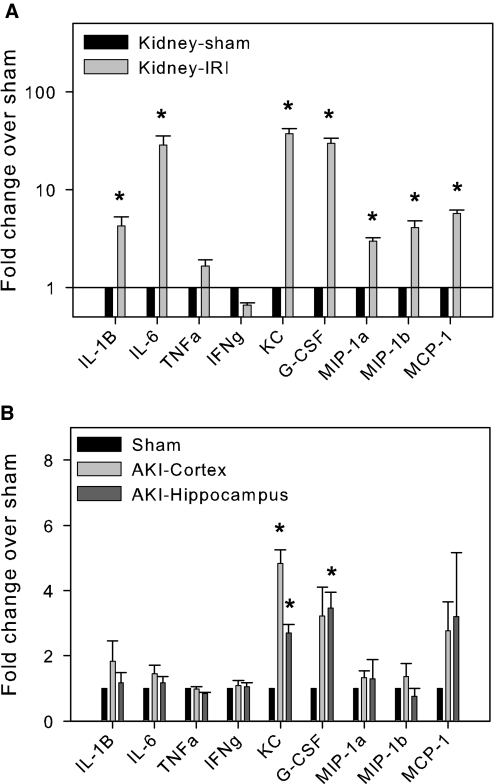
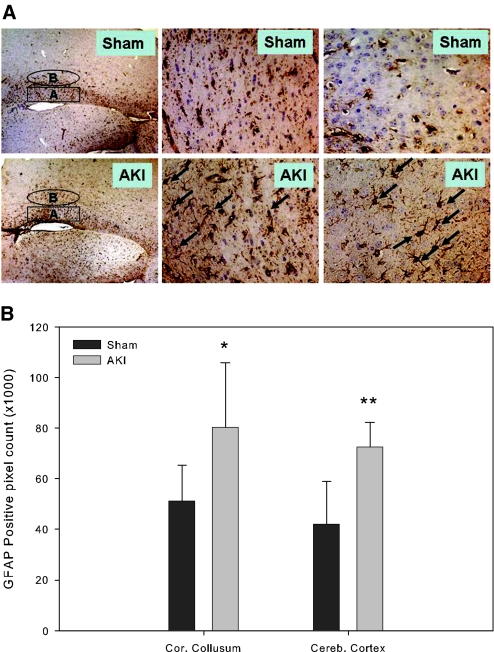
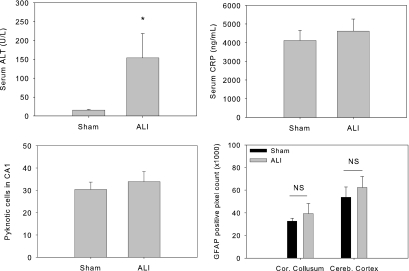
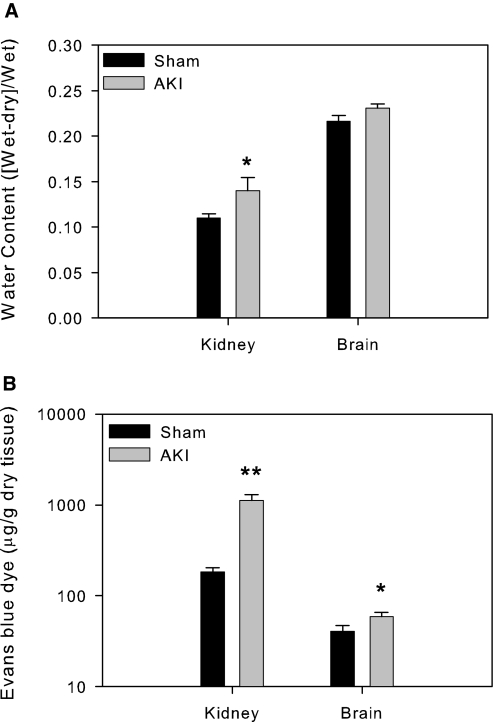
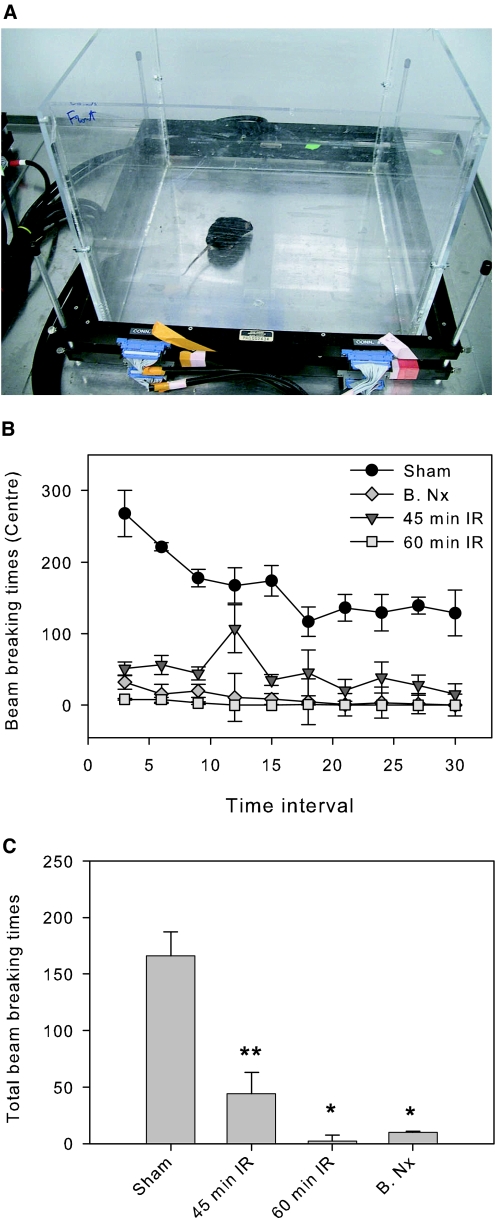
Although neurologic sequelae of acute kidney injury (AKI) are well described, the pathogenesis of acute uremic encephalopathy is poorly understood. This study examined the short-term effect of ischemic AKI on inflammatory and functional changes of the brain in mice by inducing bilateral renal ischemia for 60 min and studying the brains 24 h later. Compared with sham mice, mice with AKI had increased neuronal pyknosis and microgliosis in the brain. AKI also led to increased levels of the proinflammatory chemokines keratinocyte-derived chemoattractant and G-CSF in the cerebral cortex and hippocampus and increased expression of glial fibrillary acidic protein in astrocytes in the cortex and corpus callosum. In addition, extravasation of Evans blue dye into the brain suggested that the blood-brain barrier was disrupted in mice with AKI. Because liver failure also leads to encephalopathy, ischemic liver injury was induced in mice with normal renal function; neuronal pyknosis and glial fibrillary acidic protein expression were not increased, suggesting differential effects on the brain depending on the organ injured. For evaluation of the effects of AKI on brain function, locomotor activity was studied using an open field test. Mice subjected to renal ischemia or bilateral nephrectomy had moderate to severe declines in locomotor activity compared with sham-operated mice. These data demonstrate that severe ischemic AKI induces inflammation and functional changes in the brain. Targeting these pathways could reduce morbidity and mortality in critically ill patients with severe AKI.


Figures

Figure 1.
Figure 1.
Pyknotic neurons in the hippocampus of the brain. All mice underwent 60 min of bilateral renal ischemia followed by reperfusion or a sham operation. The brains were harvested at 24 h after surgery and processed for histologic examination by H&E staining. (A) Representative microphotograph of mouse brain hippocampus. The entire hippocampus is shown in the top panel and the high-powered CA1 region is shown in the bottom panel. Arrows indicate pyknotic neuronal cell bodies. (B) Pyknotic neuronal cells count. *P = 0.022 versus sham; n = 6 to 8. Magnifications: ×4 in A, top; ×40 in A, bottom.
Figure 2.
Figure 2.
Microglial cells in the hippocampus of mouse brain. All mice underwent either 60 min of renal ischemia followed by reperfusion or a sham operation. The brains were harvested at 24 h after surgery and stained with IBA1 antibody for activated microglial cells (macrophage in the brain) by immunofluorescence technique. (A) Representative microphotographs of the hippocampus. Arrows indicate positively stained microglia. (B) IBA1-positive microglial cell count in the hippocampus. *P = 0.001 versus sham; n = 6 to 7. Magnifications: ×4 in A, left; ×40 in A, right.
Figure 3.
Figure 3.
Serum CRP (A) and serum G-CSF (B). All mice underwent either 60 min of renal ischemia followed by reperfusion or a sham operation. The blood samples were obtained and measured for serum CRP and G-CSF. Compared with sham-operated mice, mice with AKI showed significantly increased serum CRP at 24 h and increased serum G-CSF at 6, 24, and 48 h after surgery. (A) Serum CRP, sham versus AKI, 5759 ± 782 versus 7243 ± 1331 ng/ml (*P = 0.026, n = 7). (B) Serum G-CSF, sham versus AKI, at 6 h: 218.7 ± 49.5 versus 647.2 ± 217.3 ng/ml (*P = 0.022); at 24 h: 76.33 versus 681.9 ng/ml (*P = 0.016); at 48 h: 47.17 versus 409.05 ng/ml (*P = 0.036 by t-test in A and B at 6 h and by Rank sum test in B at 24 or 48 h, n = 3 to 5).
Figure 4.
Figure 4.
Cytokine/chemokine protein array in the kidney (A; *P < 0.03 to 0.002 versus sham) and the brain (B; *P < 0.003 to 0.0008 versus sham). All mice underwent 60 min of bilateral renal ischemia followed by reperfusion or a sham operation and were followed for 24 h. The kidneys and brains were harvested after exsanguinations and processed for cytokine/chemokine protein array. Data are presented as a fold change of each protein from ischemic mice over that from sham-operated mice. Compared with sham mice, KC and G-CSF were significantly increased in both the kidney and the brain (cortex and hippocampus; n = 3).
Figure 5.
Figure 5.
GFAP expression in the mouse brain astrocytes. All mice underwent 60 min of bilateral renal ischemia followed by reperfusion or a sham operation. The brains were harvested at 24 h after surgery and stained with antibody against GFAP for activated astrocytes. (A) Microphotographs (circled B in A and D indicates adjacent cerebral cortex, high powered in C and F; squared A in A and D indicates corpus callosum, high powered in B and E. Arrows indicate GFAP positively stained astrocytes. (B) GFAP-positive pixel count, sham versus AKI, cerebral cortex: 42130 ± 16791 versus 72660 ± 9548, P = 0.001; corpus callosum: 51316 ± 14193 versus 80383 ± 25613. (*P = 0.049, **P = 0.001 versus sham; n = 5 to 8). Magnifications: ×4 in A and D; ×40 in B, C, E, and F.
Figure 6.
Figure 6.
Liver function, blood inflammation, and brain changes in mice with ischemic ALI. Mice underwent either 45 min of lobar ischemia followed by reperfusion or a sham operation. The blood was taken at 24 h after surgery and measured for ALT and CRP. The brains were processed for histology and GFAP staining. Mice with liver ischemia had significant increase in serum ALT meanwhile with a comparable serum CRP, brain pyknotic neuronal cell count, and brain GFAP expression when compared with sham operated mice. (*P = 0.016 versus sham; n = 4 to 5). Sham versus ALI, serum CRP: 4116.154 ± 541.709 versus 4625.344 ± 642.728 ng/ml (P = 0.213; n = 5); pyknotic neurons: 30.4 ± 3.3 versus 33.9 ± 4.5 ng/ml (P = 0.157; n = 5 to 9); GFAP-positive pixel analysis: corpus collosum 32619 ± 2715 versus 39379 ± 8890 ng/ml (P = 0.173); cerebral cortex 53833 ± 9071 versus 62383 ± 9802 ng/ml (P = 0.167; n = 5 to 9).
Figure 7.
Figure 7.
Brain water content (A) and Evans blue extravasations (B). All mice underwent either 60 min of bilateral renal ischemia followed by reperfusion or underwent a sham operation. The brains were harvested at 24 h after surgery and accessed for water content or for Evans blue dye extravasations. As a positive control, water content and vascular permeability were increased in the ischemic kidney as expected. There was a significant increase in Evans blue extravasations and a comparable level in water content in the brain from the mice with AKI when compared with sham-operated mice. (A) Brain water content index, sham versus AKI, 0.216 ± 0.007 versus 0.231 ± 0.005, P = 0.10. (B) Brain Evans blue dye extravasations in μg/g tissue, sham versus AKI, 40.7 ± 6.29 versus 58.6 ± 7.13, *P = 0.034, n = 3. In the kidney, **P < 0.001 versus sham, n = 4.
Figure 8.
Figure 8.
Open field test for locomotor activity. All mice were subjected to 45 or 60 min of bilateral renal ischemia, a bilateral nephrectomy, or a sham operation. Twenty-four hours later, mice underwent a 30-min open field test for locomotive activity in an activity measurement chamber (A). Locomotor activity was assessed by the times breaking electronic beam during the test. Compared with sham-operated mice, locomotion was moderately decreased in mice with 45 min of renal ischemia and was profoundly declined in mice with 60 min of renal ischemia or bilateral nephrectomy (B.Nx). B, average of activity over a 30-min period. C, total activity. *P = 0.01 versus sham; **P < 0.02 versus 60 min of IRI or B.Nx; n = 4 in each group).

Comment in

References

    1. Rabb H, Chamoun F, Hotchkiss J: Molecular mechanisms underlying combined kidney-lung dysfunction during acute renal failure. Contrib Nephrol 41–52, 2001 - PubMed
    1. Kelly KJ: Acute renal failure: much more than a kidney disease. Semin Nephrol 26: 105–113, 2006 - PubMed
    1. Star RA: Treatment of acute renal failure. Kidney Int 54: 1817–1831, 1998 - PubMed
    1. Brouns R, De Deyn PP: Neurological complications in renal failure: A review. Clin Neurol Neurosurg 107: 1–16, 2004 - PubMed
    1. Burn DJ, Bates D: Neurology and the kidney. J Neurol Neurosurg Psychiatry 65: 810–821, 1998 - PMC - PubMed

Publication types

MeSH terms