Review
. 2008 Mar-Apr;9(2):162-74.
doi: 10.3348/kjr.2008.9.2.162.

Intrapancreatic accessory spleen: findings on MR Imaging, CT, US and scintigraphy, and the pathologic analysis

Affiliations
Review

Intrapancreatic accessory spleen: findings on MR Imaging, CT, US and scintigraphy, and the pathologic analysis

Se Hyung Kim et al. Korean J Radiol. 2008 Mar-Apr.

Abstract

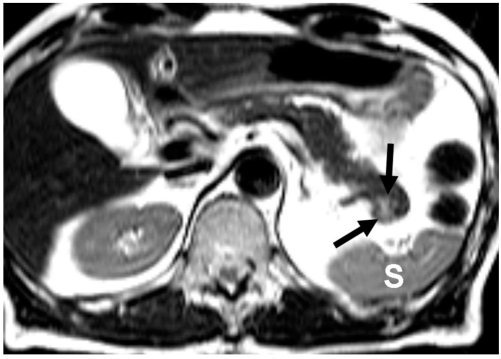
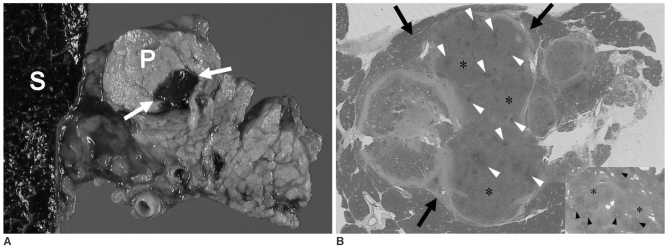
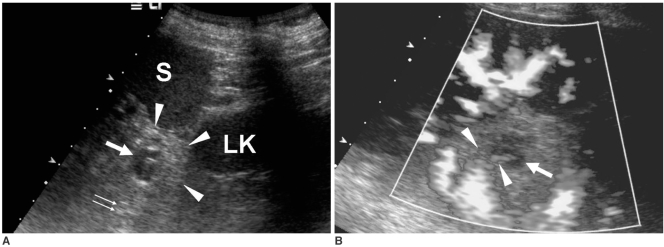
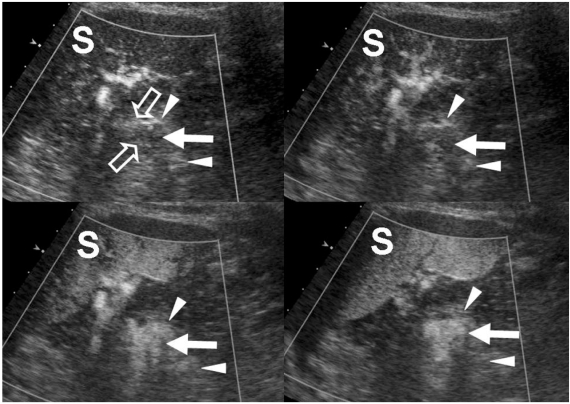
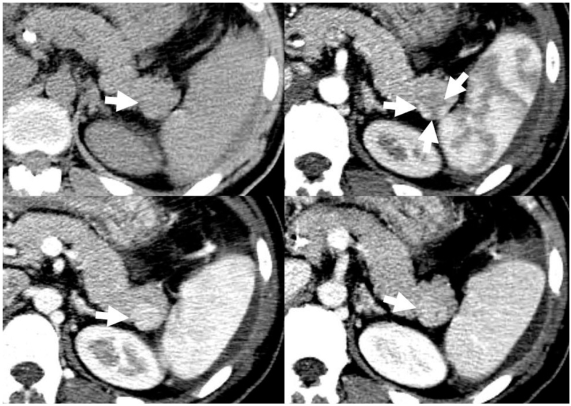
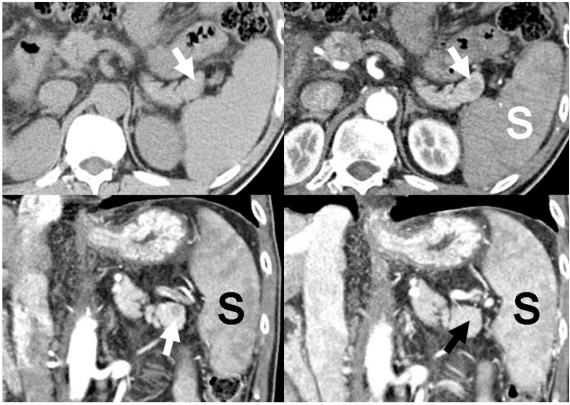
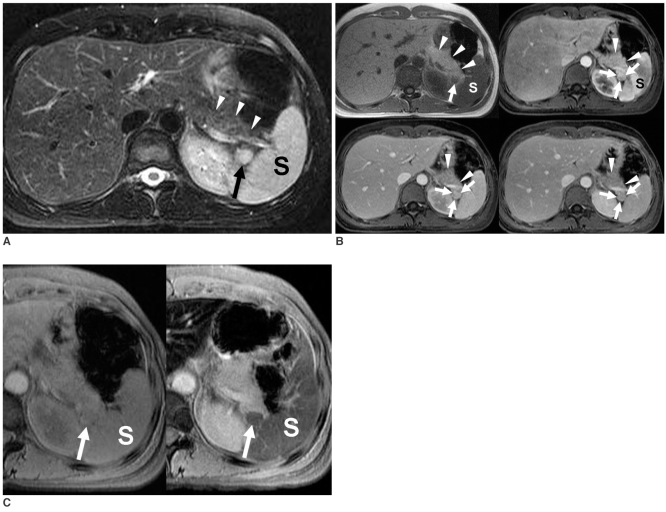
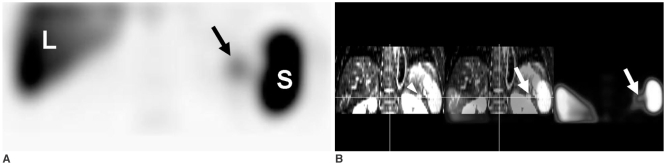
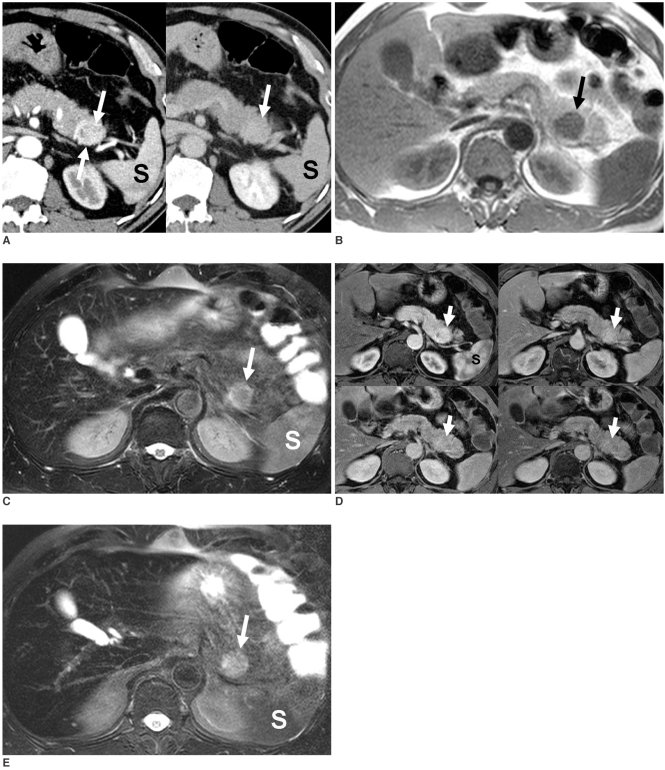
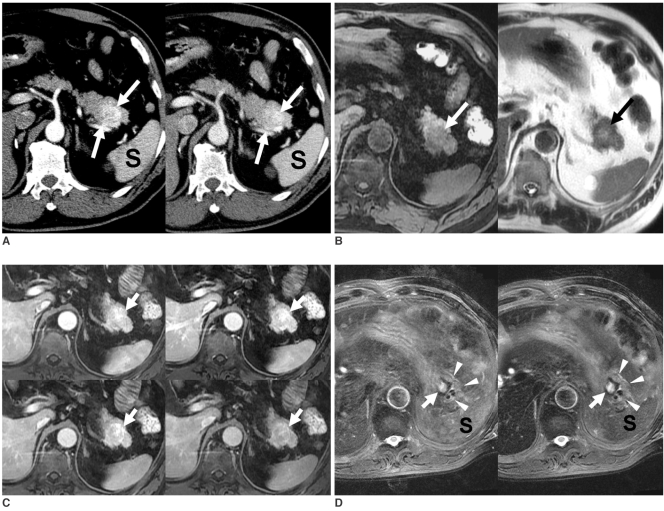
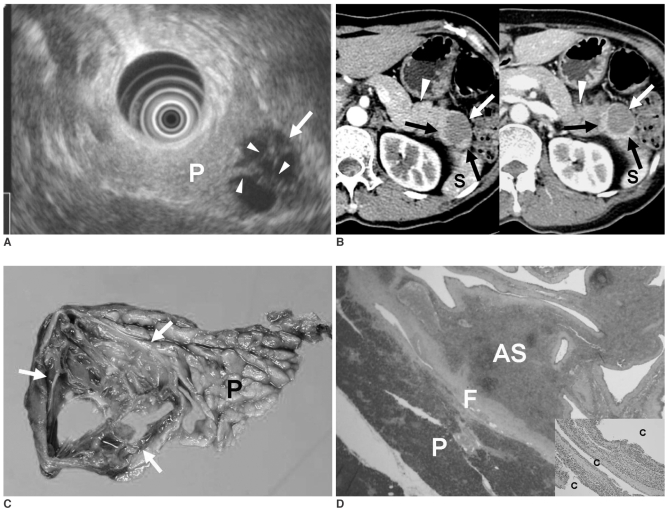
Although the tail of the pancreas is the second most common site of an accessory spleen, intrapancreatic accessory spleen (IPAS) has rarely been noted radiologically. However, as the imaging techniques have recently advanced, IPAS will be more frequently detected as an incidental pancreatic nodule on CT or MRI. Because accessory spleens usually pose no clinical problems, it is important to characterize accessory spleens as noninvasively as possible. An IPAS has similar characteristics to those of the spleen on the precontrast and contrast-enhanced images of all the imaging modalities. In particular, inhomogeneous enhancement of an IPAS in its early phases may be a diagnostic clue. Superparamagnetic iron oxide (SPIO)-enhanced MRI and Levovist-enhanced US, and the mechanisms of which are theoretically similar to that of Tc-99m scintigraphy, can be used as alternative tools to confirm the diagnosis of IPAS. An IPAS shows a significant signal drop similar to the spleen on the SPIO-enhanced T2 or T2*-weighted imaging and prolonged enhancement on the delayed hepatosplenic phase of contrast-enhanced US. We review and illustrate the differential points between IPAS and hypervascular pancreatic tumors in this manuscript.


Figures

Fig. 1
Fig. 1
Gross pathologic and histologic findings of intrapancreatic accessory spleen. A. Cross section of resected specimen of intrapancreatic accessory spleen shows reddish nodule (arrows) surrounded by yellowish pancreatic parenchyma (P). S = main spleen B. Photomicrographs (original magnification, Hematoxylin & Eosin staining, ×100) show splenic tissue surrounded by fibrous capsule (arrows). Note higher white (arrowheads)-to-red (*) pulp ratio in intrapancreatic accessory spleen than that in normal spleen (right lower corner).
Fig. 2
Fig. 2
70-year-old man with intrapancreatic accessory spleen. On T2-weighted turbo spin-echo image, intrapancreatic accessory spleen (arrows) shows high signal intensity compared to pancreas. Lesion also has slightly higher signal intensity than spleen (S). Intrapancreatic accessory spleen was confirmed by Tc-99m SPECT.
Fig. 3
Fig. 3
US appearance of intrapancreatic accessory spleen. A. Oblique coronal gray-scale US scan shows 2.4-cm size lobulated intrapancreatic accessory spleen (arrow) that is slightly hypoechoic relative to surrounding pancreas tissue (arrowheads) and it has thin echogenic rim. Note posterior acoustic enhancement (double arrow) behind lesion. S = spleen, LK = left kidney B. Power Doppler US image demonstrates two vascular pedicles (arrowheads) entering into intrapancreatic accessory spleen (arrow).
Fig. 4
Fig. 4
Levovist-enhanced US appearance of intrapancreatic accessory spleen. On serial contrast-enhanced US images obtained 22 sec (upper left), 40 sec (upper right), 88 sec (lower left) and 4 minutes (lower right) after contrast injection, enhancement patterns of intrapancreatic accessory spleen (arrow) that are similar to that of spleen are demonstrated on all four dynamic phases. Note clearly visualized vascular pedicles (open arrows) within intrapancreatic accessory spleen on early vascular phase image (upper left) and early heterogeneous enhancement of lesion (arrow) on late arterial phase image (upper right). Prolonged and homogeneous enhancement of intrapancreatic accessory spleen on delayed hepatosplenic parenchymal phase is one of characteristic US features of intrapancreatic accessory spleen (lower right). Intrapancreatic accessory spleen (arrow) and main spleen (S) show higher echogenicity than that of pancreas (arrowheads) on all contrast-enhanced US phases.
Fig. 5
Fig. 5
Typical multidetector CT appearance of intrapancreatic accessory spleen. On precontrast CT image (left upper), lesion shows isoattenuation compared to pancreas and spleen. On contrast-enhanced axial CT images obtained during arterial phase (right upper), pancreatic phase (left lower), and portal venous (right lower) phase, intrapancreatic accessory spleen (arrows) is located in tail of pancreas and it shows high attenuation compared to pancreas on all phases and it is isoattenuating compared to spleen. Note inhomogeneous enhancement within lesion, which is identical to zebra-striped enhancement of spleen on arterial phase (right upper).
Fig. 6
Fig. 6
Atypical CT appearance of small intrapancreatic accessory spleen in 52-year-old man with advanced liver cirrhosis. On precontrast axial CT scan (left upper), lesion (arrow) shows iso-attenuation compared to pancreas. Axial CT image obtained during arterial phase (right upper) depicts round, well-demarcated and low-attenuating nodule (arrow) in pancreas tail. However, lesion shows attenuation that's identical to spleen (S). On oblique coronal multiplanar reconstruction images obtained during pancreatic (left lower) and portal (right lower) phases, intrapancreatic accessory spleen (arrows) shows low attenuation compared to pancreas on pancreatic phase (left lower), iso-attenuation compared to pancreas on portal phase (right lower) and iso-attenuation compared to spleen (S) on both phases. Even though main spleen still shows slight heterogeneity on portal phase (right lower), intrapancreatic accessory spleen can not be distinguished from adjacent pancreas on portal phase due to its small size. Retarded splenic perfusion due to liver cirrhosis is regarded as possible cause for such low attenuation of both spleen and intrapancreatic accessory spleen on early CT phases.
Fig. 7
Fig. 7
MRI features of intrapancreatic accessory spleen. A. Intrapancreatic accessory spleen (arrow) shows high signal intensity compared to pancreas (arrowheads) on axial, fat-saturated, T2-weighted turbo spin-echo image. B. Lesion (arrow) shows low signal intensity compared to pancreas (arrowheads) on axial, 2D T1-weighted gradient echo image (left upper). Signal intensity of intrapancreatic accessory spleen is similar to that of spleen (S). On gadolinium-enhanced MR images obtained during arterial phase (right upper), lesion (arrows) shows intense heterogeneous lesion enhancement. Heterogeneous enhancement, which is characteristic of splenic tissue during early phase (within 70 secs), is identical to that of spleen (S). This is due to different flow rates through cords of red and white pulp. On portal (left lower) and delayed (right lower) phases, lesion (arrows) has become homogenously high and iso-intense relative to surrounding pancreas parenchyma (arrowheads), respectively. Signal intensity of lesion is exactly identical to that of spleen. C. Precontrast (left) and SPIO-enhanced (right) T2*-weighted images show signal drop in intrapancreatic accessory spleen (arrows) to similar degree compared to that of main spleen (S) when compared to precontrast image (left).
Fig. 8
Fig. 8
Technetium-99m heat-damaged red blood cell SPECT of intrapancreatic accessory spleen. A. Coronal Tc-99m SPECT image of upper abdomen shows hot uptake foci (arrow) near splenic hilum. S = spleen, L = liver B. Co-registered and fused image (middle) between coronal Tc-99m SPECT (right) and T2-weighted coronal MR (left) images, confirms that SPECT hot uptake (arrows) matched corresponding high-signal intensity intrapancreatic lesion (arrowhead) seen on MRI.
Fig. 9
Fig. 9
Islet cell tumor in tail of the pancreas. A. Arterial phase CT scan (left) reveals well-defined, homogeneous, hyperattenuating mass (arrow) in pancreatic tail. Note zebra-striped enhancement of spleen (S). On delayed phase scan (right), lesion (arrow) is nearly iso-attenuating compared to pancreas. B, C. Lesion (arrow) is hypointense on T1-weighted gradient echo image (B) and hyperintense on T2-weighted fat saturated turbo spin-echo image (C). S: spleen D. On serial gadolinium-enhanced MR images obtained during arterial (left upper), pancreatic (right upper), portal (left lower), and delayed (right lower) phases, lesion conspicuity was most dramatic on arterial phase and this was diminished on following three phases. Note homogeneous enhancement of lesion (arrows) compared to zebra-striped enhancement of spleen (S) on arterial phase. E. On SPIO-enhanced T2-weighted image, no signal drop was seen in lesion (arrow). Note signal drop of spleen (S) when compared to precontrast image (C).
Fig. 10
Fig. 10
Solitary pancreatic metastasis from renal cell carcinoma that occurred six years after right nephrectomy. A. On arterial phase CT scan (left), lesion (arrows) enhanced more strongly than did spleen (S). Delayed phase CT scan (right) reveals slightly higher attenuation of lesion (arrows) compared to that of pancreas. B. Lesion (arrows) is hypointense and heterogeneous hyperintense compared to pancreas on T1- (left) and T2-weighted (right) MR images, respectively. C. On serial dynamic Gd-enhanced MR images obtained at similar phases to those in Figure 9, metastasis (arrows) demonstrates enhancement similar to that described on CT. D. Precontrast (left) and SPIO-enhanced (right) fat-saturated T2-weighted images do not show any signal drop of lesion (arrows) in pancreas (arrowheads). Note signal drop of spleen (S) on SPIO-enhanced image (right) when compared to precontrast image (left).
Fig. 11
Fig. 11
Epidermoid cyst in intrapancreatic accessory spleen. A. Endoscopic US scan shows well-demarcated, low echoic lesion (arrow) attached to pancreatic tail (P) at splenic hilum. Lesion has several thick septa (arrowheads). B. Axial CT images obtained during arterial (left) and portal (right) phases demonstrate cystic mass (arrows) connected to pancreatic tail (arrowheads). Solid component, which was later revealed to be intrapancreatic accessory spleen, shows same attenuation as spleen (S). C. Gross specimen of distal pancreatectomy shows cyst (arrows) in pancreatic tail (P). D. On photomicrograph (Hematoxylin & Eosin staining, ×40), thin fibrous capsule (F) separates intrapancreatic accessory spleen (AS) from pancreas (P). On high power field photomicrograph (Hematoxylin & Eosin staining, ×100) (right lower corner), cysts (c) are lined by stratified squamous epithelium.

Similar articles

Cited by

References

    1. Movitz D. Accessory spleens and experimental splenosis. Principles of growth. Chic Med Sch Q. 1967;26:183–187. - PubMed
    1. Halpert B, Gyorkey F. Lesions observed in accessory spleens of 311 patients. Am J Clin Pathol. 1959;32:165–168. - PubMed
    1. Eraklis AJ, Filler RM. Splenectomy in childhood: a review of 1413 cases. J Pediatr Surg. 1972;7:382–388. - PubMed
    1. Harris GN, Kase DJ, Bradnock H, Mckinley MJ. Accessory spleen causing a mass in the tail of the pancreas: MR imaging findings. AJR Am J Roentgenol. 1994;163:1120–1121. - PubMed
    1. Hamada T, Isaji S, Mizuno S, Tabata M, Yamagiwa K, Yokoi H, et al. Laparoscopic spleen-preserving pancreatic tail resection for an intrapancreatic accessory spleen mimicking a nonfunctioning endocrine tumor: report of a case. Surg Today. 2004;34:878–881. - PubMed