

Determining under- and oversampling of individual particle distributions in microfluidic electrophoresis with orthogonal laser-induced fluorescence detection
- PMID: 18386300
- PMCID: PMC3037013
- DOI: 10.1002/elps.200700470
Determining under- and oversampling of individual particle distributions in microfluidic electrophoresis with orthogonal laser-induced fluorescence detection
Abstract
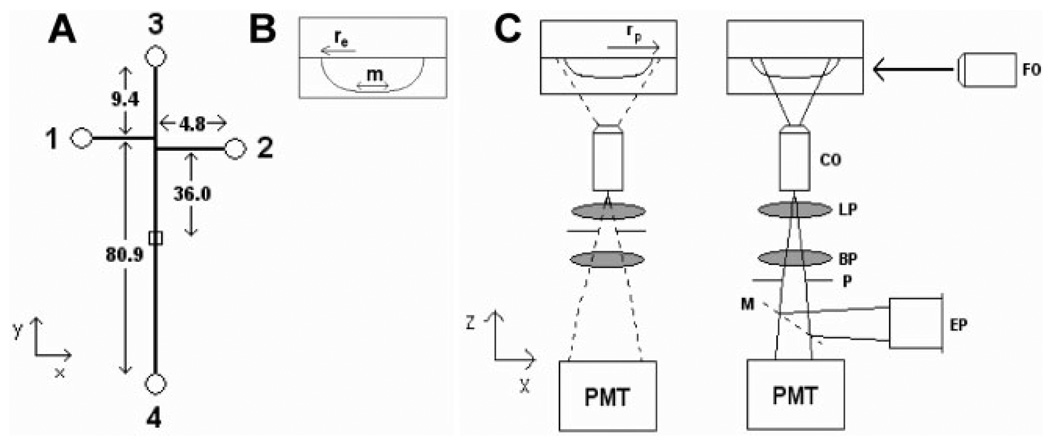
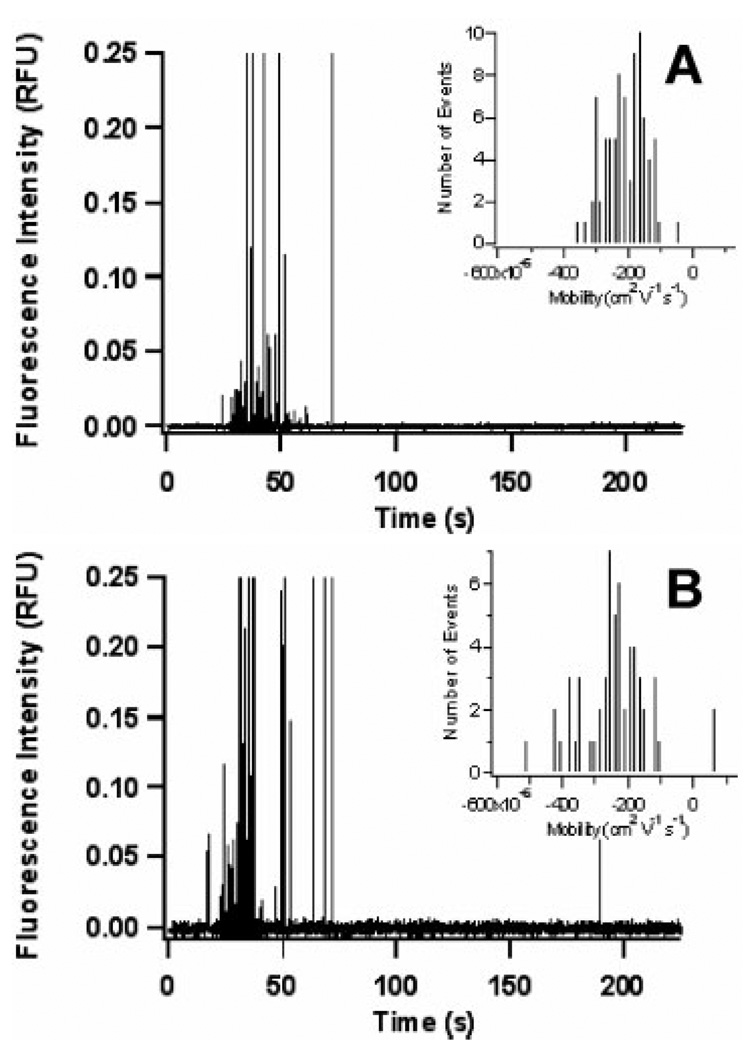
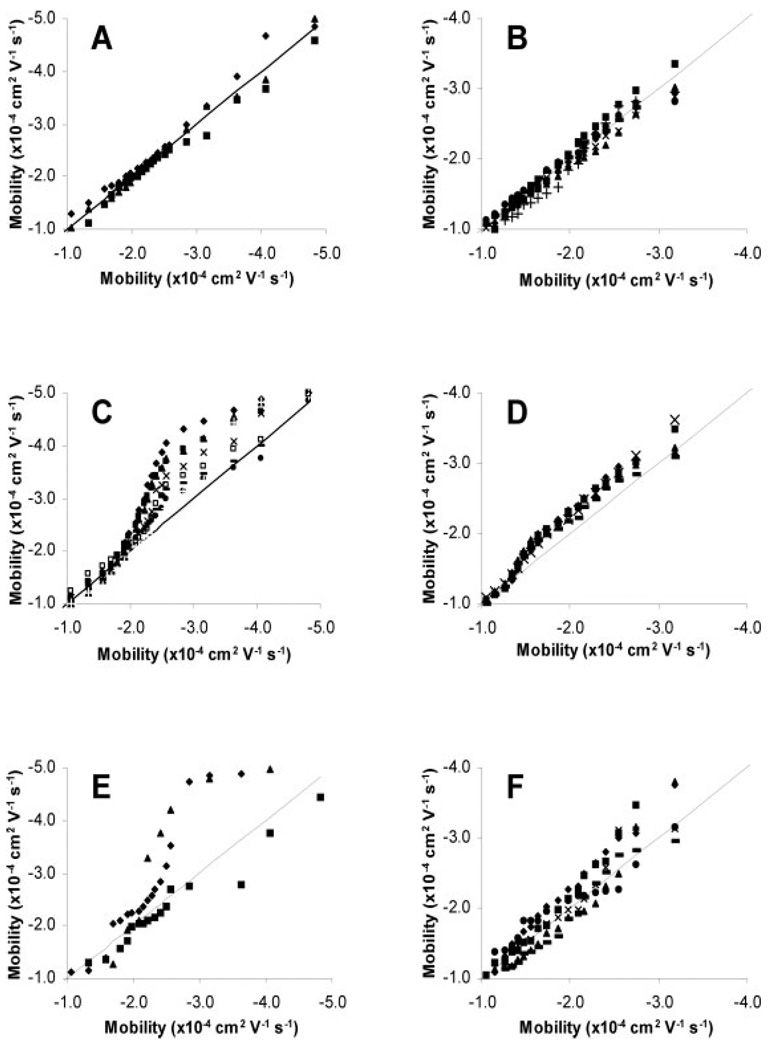
This report investigates the effects of sample size on the separation and analysis of individual biological particles using microfluidic devices equipped with an orthogonal LIF detector. A detection limit of 17 +/- 1 molecules of fluorophore is obtained using this orthogonal LIF detector under a constant flow of fluorescein, which is a significant improvement over epifluorescence, the most common LIF detection scheme used with microfluidic devices. Mitochondria from rat liver tissue and cultured 143B osteosarcoma cells are used as model biological particles. Quantile-quantile (q-q) plots were used to investigate changes in the distributions. When the number of detected mitochondrial events became too large (>72 for rat liver and >98 for 143B mitochondria), oversampling occurs. Statistical overlap theory is used to suggest that the cause of oversampling is that separation power of the microfluidic device presented is not enough to adequately separate large numbers of individual mitochondrial events. Fortunately, q-q plots make it possible to identify and exclude these distributions from data analysis. Additionally, when the number of detected events became too small (<55 for rat liver and <81 for 143B mitochondria) there were not enough events to obtain a statistically relevant mobility distribution, but these distributions can be combined to obtain a statistically relevant electrophoretic mobility distribution.
Conflict of interest statement
The authors have declared no conflict of interest.
Figures
Similar articles
-
Evaluation of individual particle capillary electrophoresis experiments via quantile analysis.J Chromatogr A. 2007 Jul 20;1157(1-2):446-53. doi: 10.1016/j.chroma.2007.04.065. Epub 2007 May 5. J Chromatogr A. 2007. PMID: 17521658 Free PMC article.
-
Analysis of subcellular sized particles. Capillary electrophoresis with post-column laser-induced fluorescence detection versus flow cytometry.J Chromatogr A. 2006 Dec 29;1137(2):249-55. doi: 10.1016/j.chroma.2006.10.011. Epub 2006 Oct 27. J Chromatogr A. 2006. PMID: 17070532
-
Analysis of mitochondria isolated from single cells.Anal Bioanal Chem. 2007 Jan;387(1):107-18. doi: 10.1007/s00216-006-0689-6. Epub 2006 Aug 26. Anal Bioanal Chem. 2007. PMID: 16937092
-
[Laser-induced fluorescence detection in micro-column separation].Se Pu. 2001 Nov;19(6):503-7. Se Pu. 2001. PMID: 12545459 Review. Chinese.
-
Single-molecule fluorescence detection in microfluidic channels--the Holy Grail in muTAS?Anal Bioanal Chem. 2005 Aug;382(8):1771-82. doi: 10.1007/s00216-005-3335-9. Epub 2005 Jun 17. Anal Bioanal Chem. 2005. PMID: 16075229 Review.
Cited by
-
Identifying indoor environmental patterns from bioaerosol material using HPLC.Anal Bioanal Chem. 2013 Jan;405(1):351-7. doi: 10.1007/s00216-012-6495-4. Epub 2012 Oct 24. Anal Bioanal Chem. 2013. PMID: 23092966 Free PMC article.
-
Recent advances in the analysis of biological particles by capillary electrophoresis.Electrophoresis. 2008 Jun;29(12):2578-86. doi: 10.1002/elps.200700917. Electrophoresis. 2008. PMID: 18576409 Free PMC article. Review.
-
Evaluation of peak overlap in migration-time distributions determined by organelle capillary electrophoresis: Type-II error analogy based on statistical-overlap theory.J Chromatogr A. 2009 Aug 28;1216(35):6335-42. doi: 10.1016/j.chroma.2009.07.001. Epub 2009 Jul 7. J Chromatogr A. 2009. PMID: 19632681 Free PMC article.
References
-
- Petit P, Diolez P, Müller P, Brown SC. FEBS Lett. 1986;196:65–70.
-
- Schrum DP, Culbertson CT, Jacobson SC, Ramsey JM. Anal. Chem. 1999;71:4173–4177. - PubMed
-
- Huang LR, Cox EC, Austin RH, Sturm JC. Science. 2004;304:987–990. - PubMed
-
- Kunst BH, Schots A, Visser AJWG. Rev. Sci. Instrum. 2004;75:2892–2898.
-
- Simonnet C, Groisman A. Anal. Chem. 2006;78:5653–5663. - PubMed
Publication types
MeSH terms
Grants and funding
LinkOut - more resources
Full Text Sources
