

Forecasting emergency department crowding: a discrete event simulation
- PMID: 18387699
- PMCID: PMC7252622
- DOI: 10.1016/j.annemergmed.2007.12.011
Forecasting emergency department crowding: a discrete event simulation
Abstract
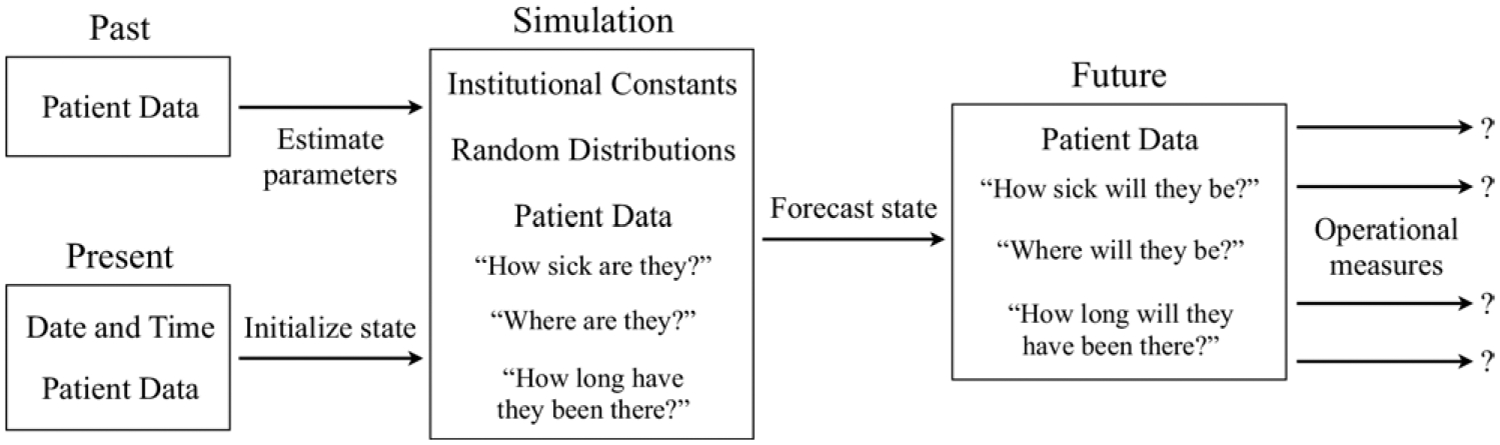
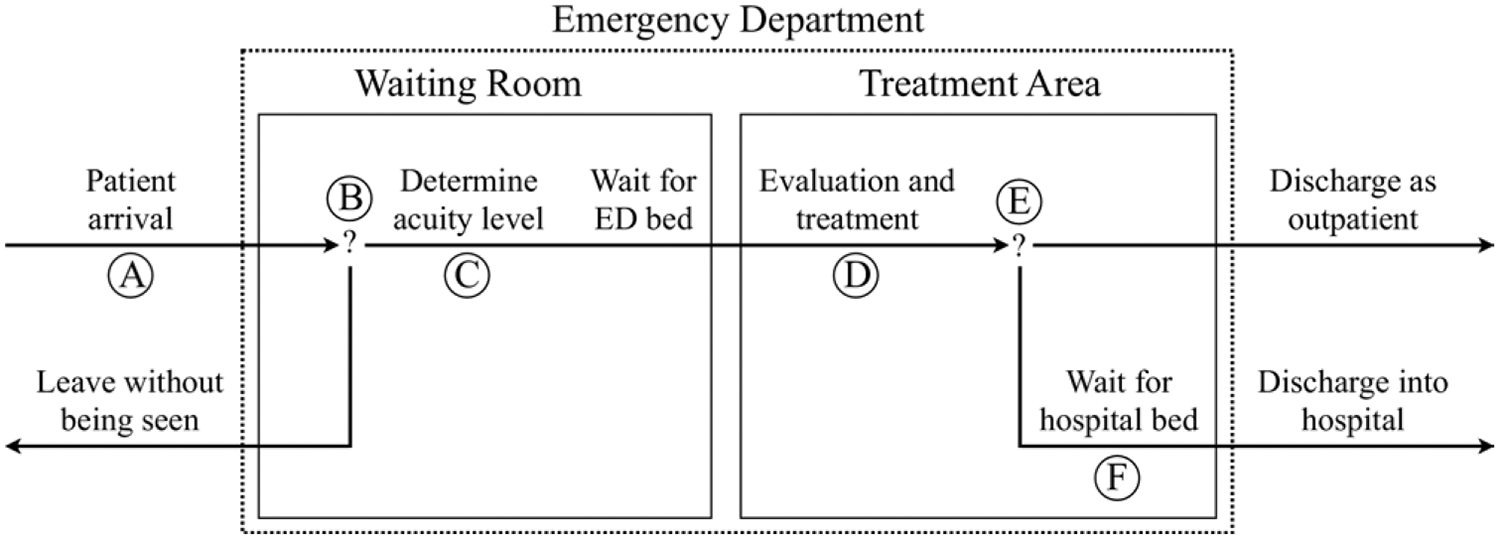
Study objective: To develop a discrete event simulation of emergency department (ED) patient flow for the purpose of forecasting near-future operating conditions and to validate the forecasts with several measures of ED crowding.
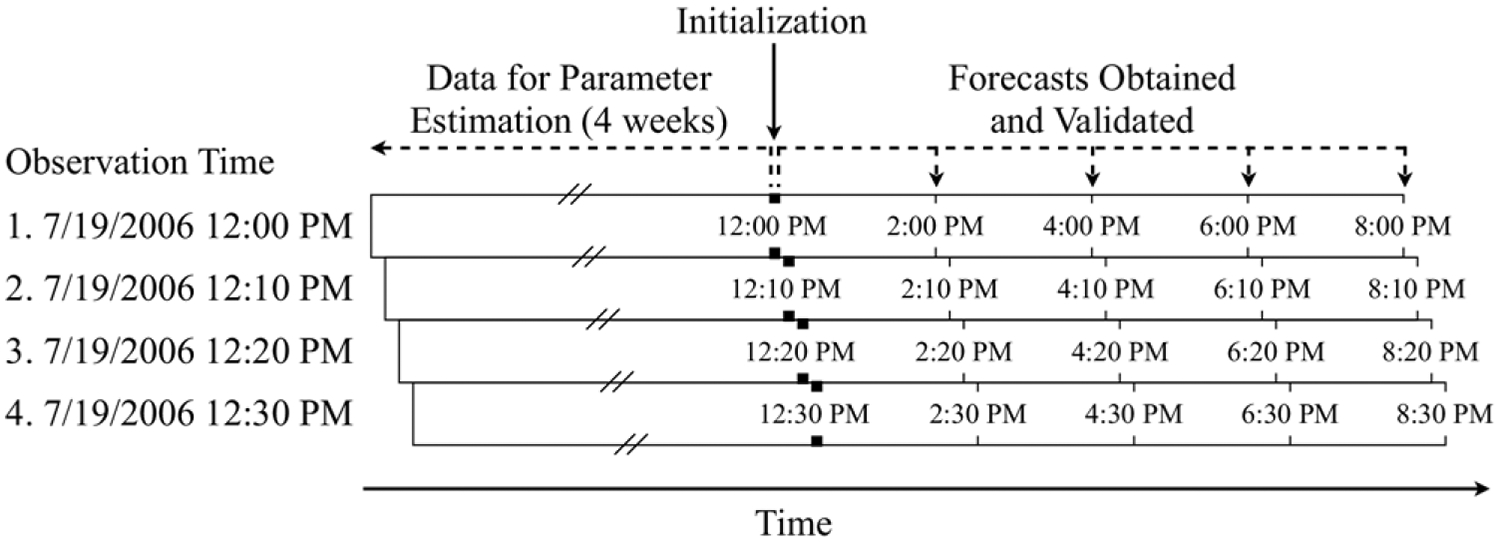
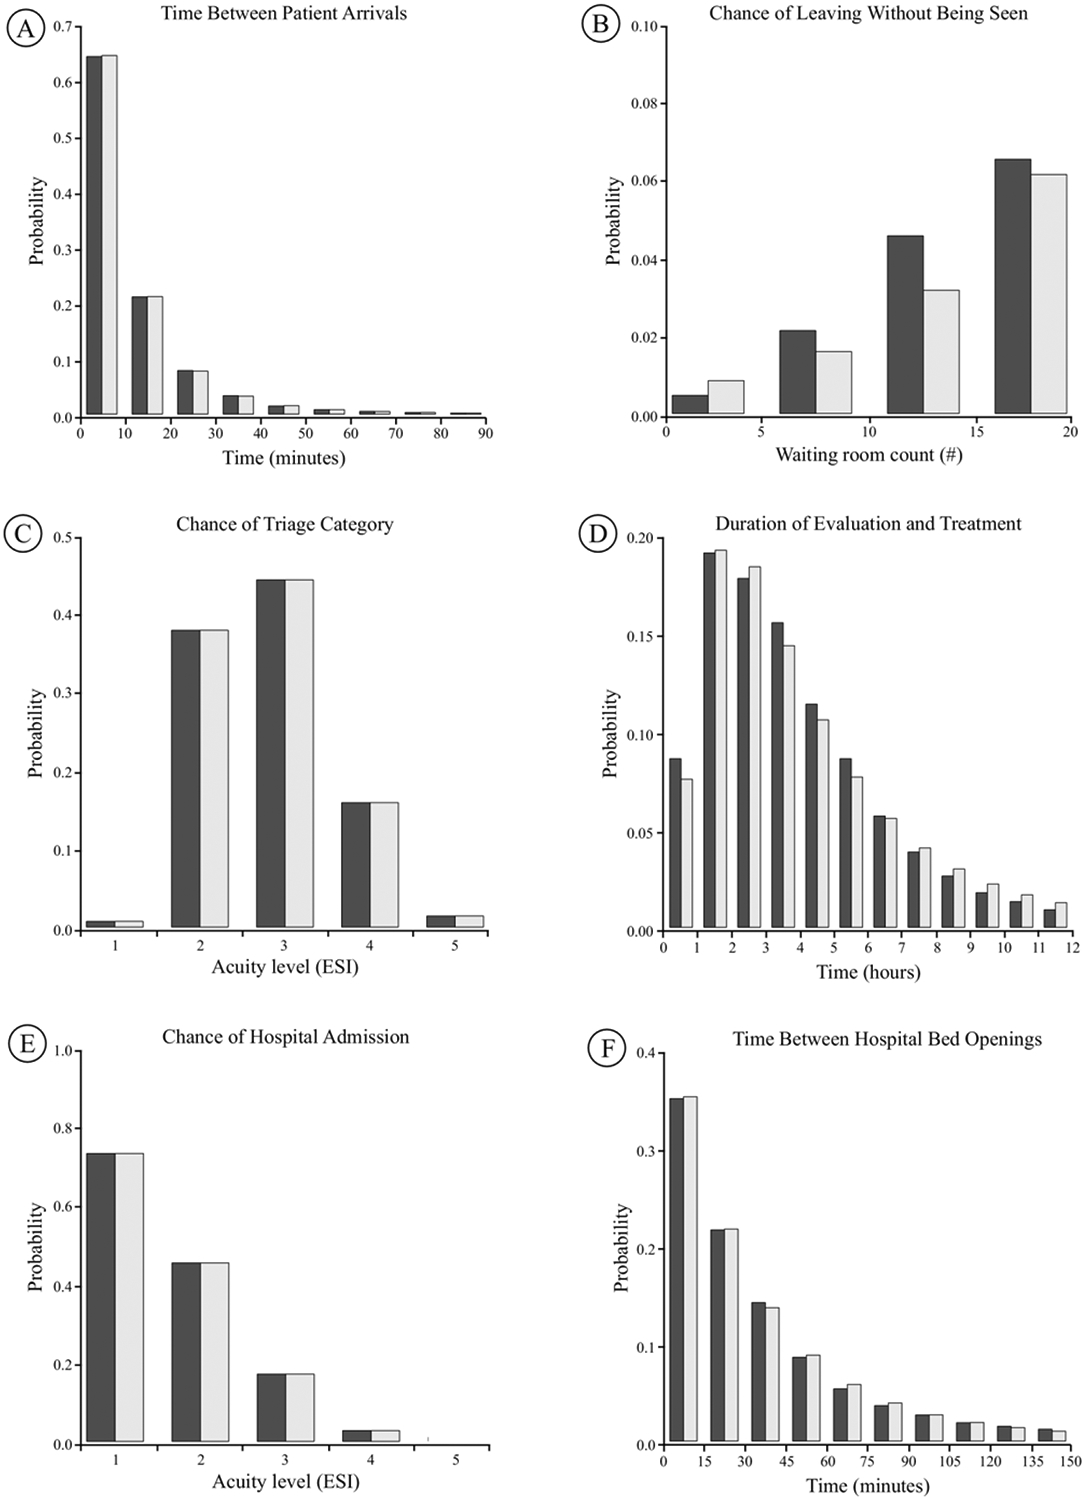
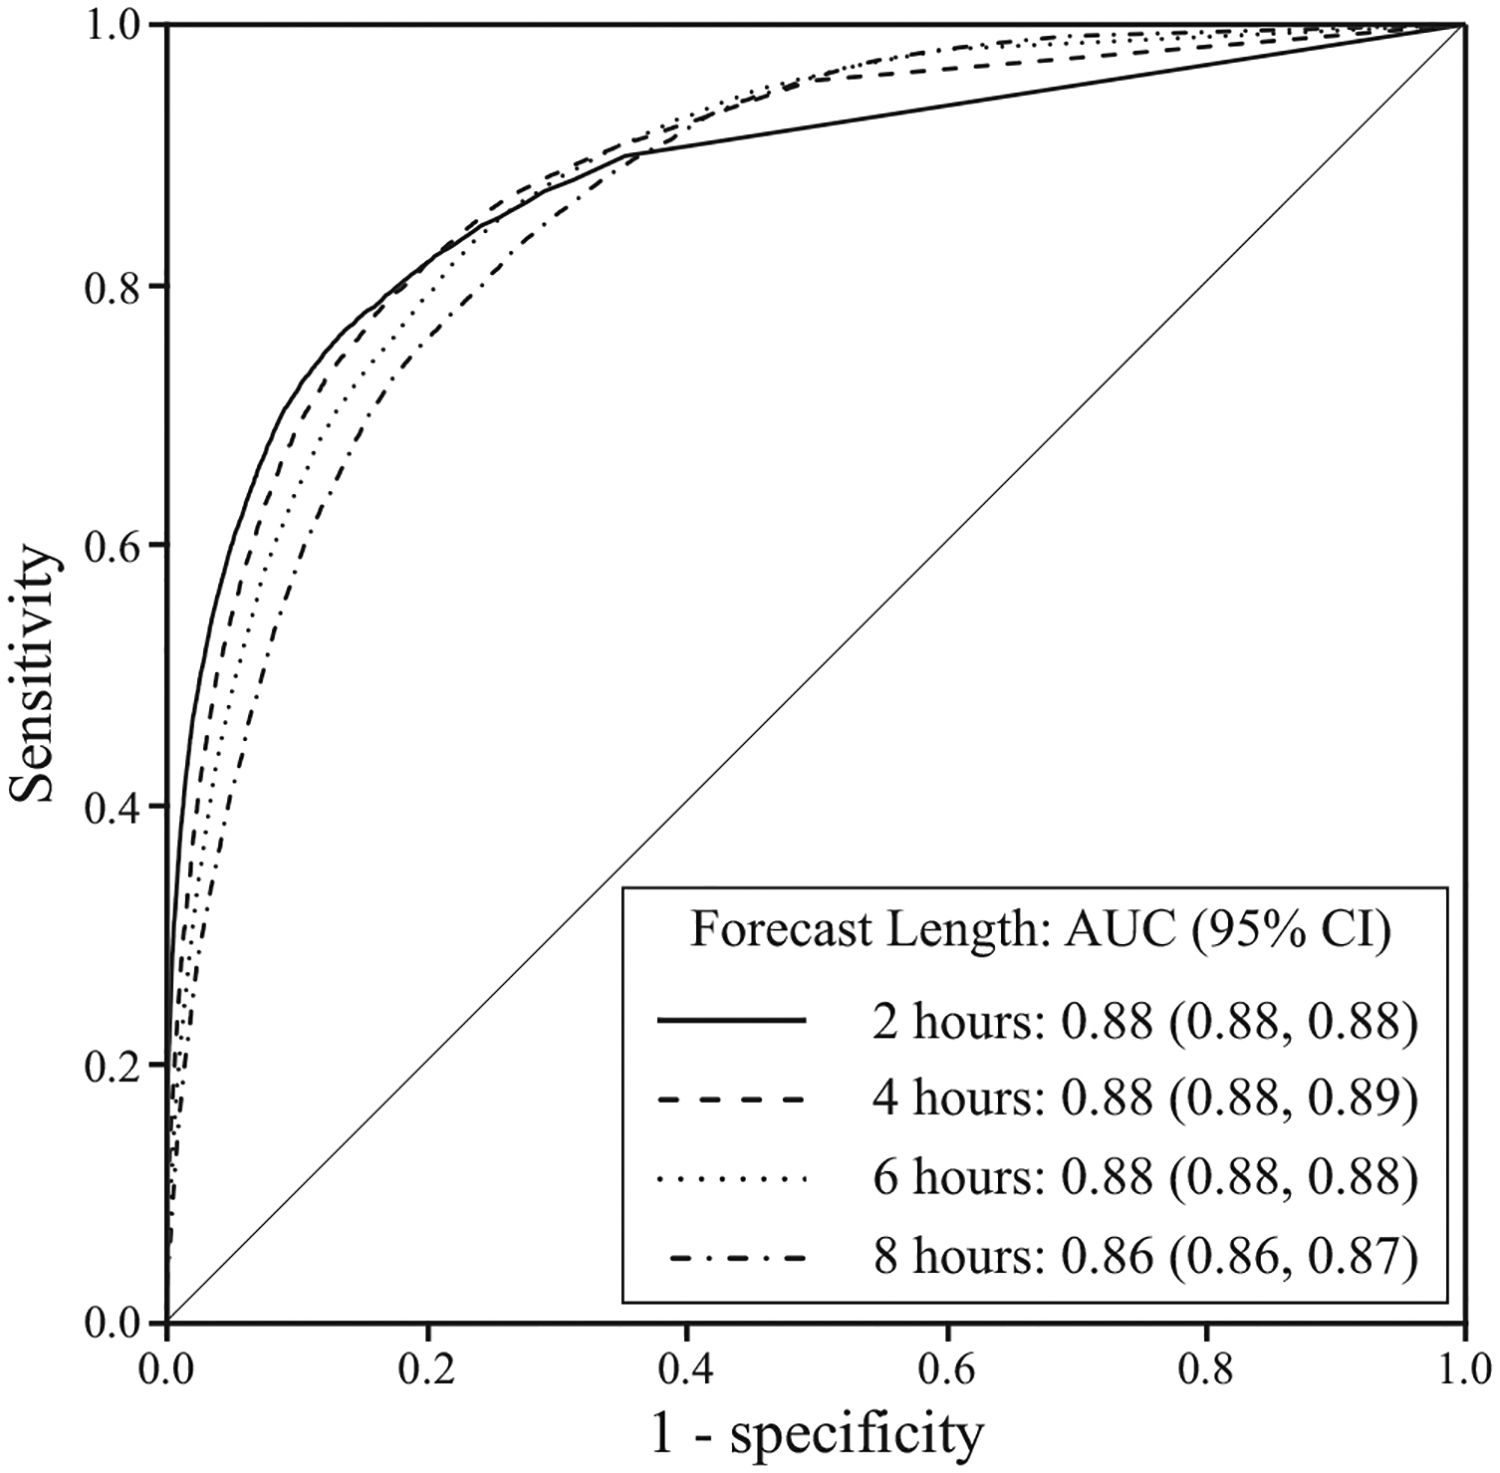
Methods: We developed a discrete event simulation of patient flow with evidence from the literature. Development was purely theoretical, whereas validation involved patient data from an academic ED. The model inputs and outputs, respectively, are 6-variable descriptions of every present and future patient in the ED. We validated the model by using a sliding-window design, ensuring separation of fitting and validation data in time series. We sampled consecutive 10-minute observations during 2006 (n=52,560). The outcome measures--all forecast 2, 4, 6, and 8 hours into the future from each observation--were the waiting count, waiting time, occupancy level, length of stay, boarding count, boarding time, and ambulance diversion. Forecasting performance was assessed with Pearson's correlation, residual summary statistics, and area under the receiver operating characteristic curve.
Results: The correlations between crowding forecasts and actual outcomes started high and decreased gradually up to 8 hours into the future (lowest Pearson's r for waiting count=0.56; waiting time=0.49; occupancy level=0.78; length of stay=0.86; boarding count=0.79; boarding time=0.80). The residual means were unbiased for all outcomes except the boarding time. The discriminatory power for ambulance diversion remained consistently high up to 8 hours into the future (lowest area under the receiver operating characteristic curve=0.86).
Conclusion: By modeling patient flow, rather than operational summary variables, our simulation forecasts several measures of near-future ED crowding, with various degrees of good performance.
Figures
References
-
- Committee on the Future of Emergency Care in the United States Health System. Hospital-based Emergency Care: At the Breaking Point. Washington, DC: National Academies Press; 2006.
-
- Kellermann AL. Crisis in the emergency department. N Engl J Med. 2006;355:1300–1303. - PubMed
-
- Miro O, Antonio MT, Jimenez S, et al. Decreased health care quality associated with emergency department overcrowding. Eur J Emerg Med. 1999;6:105–107. - PubMed
-
- Begley CE, Chang Y, Wood RC, et al. Emergency department diversion and trauma mortality: evidence from Houston, Texas. J Trauma. 2004;57):1260–1265. - PubMed
-
- Hwang U, Richardson LD, Sonuyi TO, et al. The effect of emergency department crowding on the management of pain in older adults with hip fracture. J Am Geriatr Soc. 2006;54:270–275. - PubMed
Publication types
MeSH terms
Grants and funding
LinkOut - more resources
Full Text Sources
Other Literature Sources
