

Relationship between trabecular bone structure and articular cartilage morphology and relaxation times in early OA of the knee joint using parallel MRI at 3 T
- PMID: 18387828
- PMCID: PMC2580796
- DOI: 10.1016/j.joca.2008.02.018
Relationship between trabecular bone structure and articular cartilage morphology and relaxation times in early OA of the knee joint using parallel MRI at 3 T
Abstract
Objective: To evaluate trabecular bone structure in relationship with cartilage parameters in distal femur and proximal tibia of the human knee at 3Tesla (3T) using high-resolution magnetic resonance imaging (MRI) with parallel imaging.
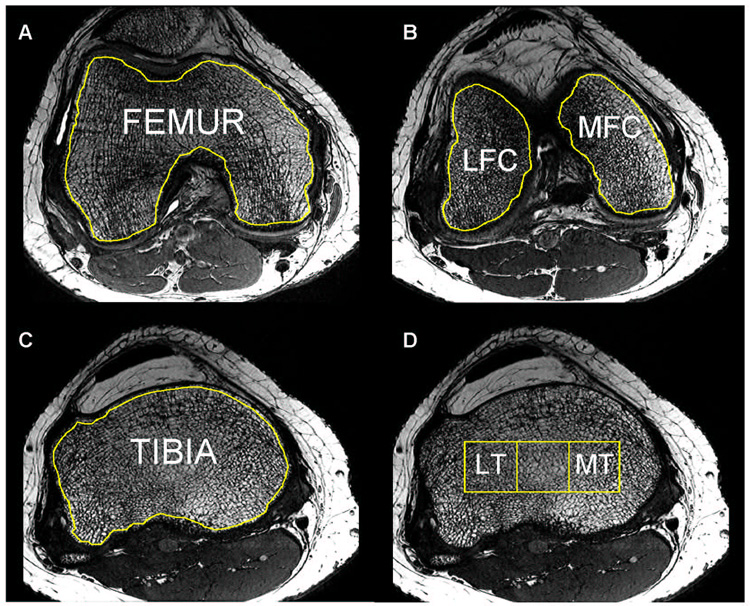
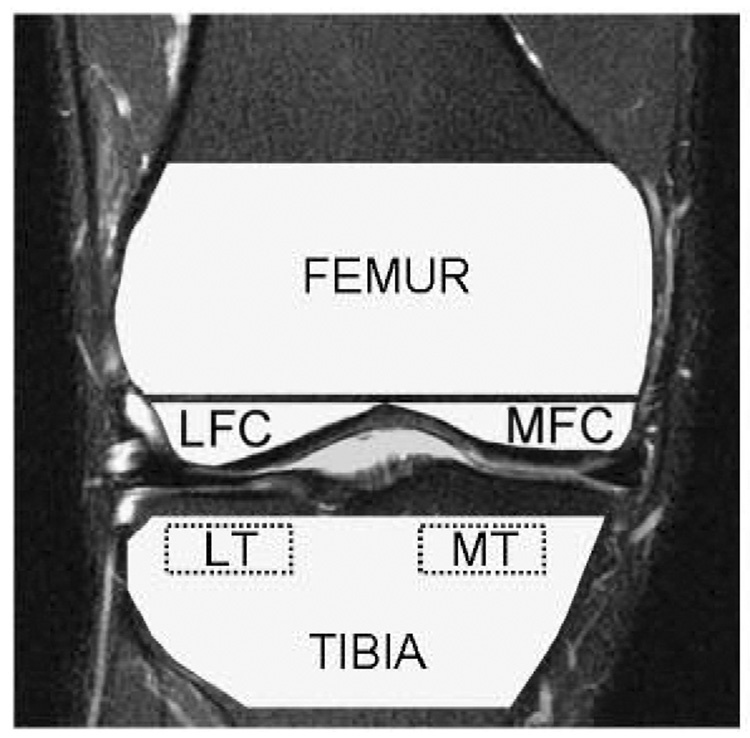
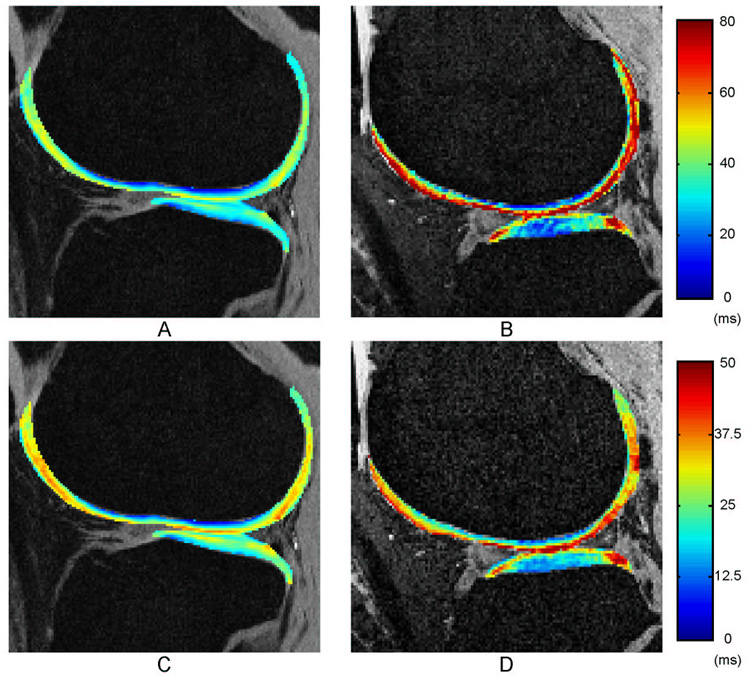
Method: Sixteen healthy controls and 16 patients with mild osteoarthritis (OA) were studied using a 3T magnetic resonance (MR) scanner and an eight-channel phased-array knee coil. Axial 3D GeneRalized Autocalibrating Partially Parallel Acquisition (GRAPPA)-based phase cycled Fast Imaging Employing Steady State Acquisition (FIESTA-c) images were acquired in order to quantify the trabecular bone structure. For assessing cartilage morphology (thickness, volume), sagittal high-resolution 3D spoiled gradient echo (SPGR) images were acquired. In a subset of the subjects, sagittal images were acquired for measuring T1rho and T2 relaxation times, using 3D T1rho and T2 mapping techniques.
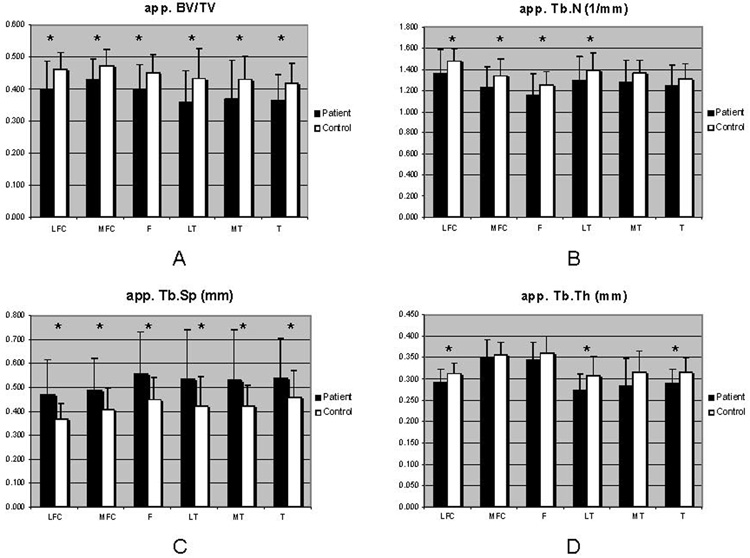
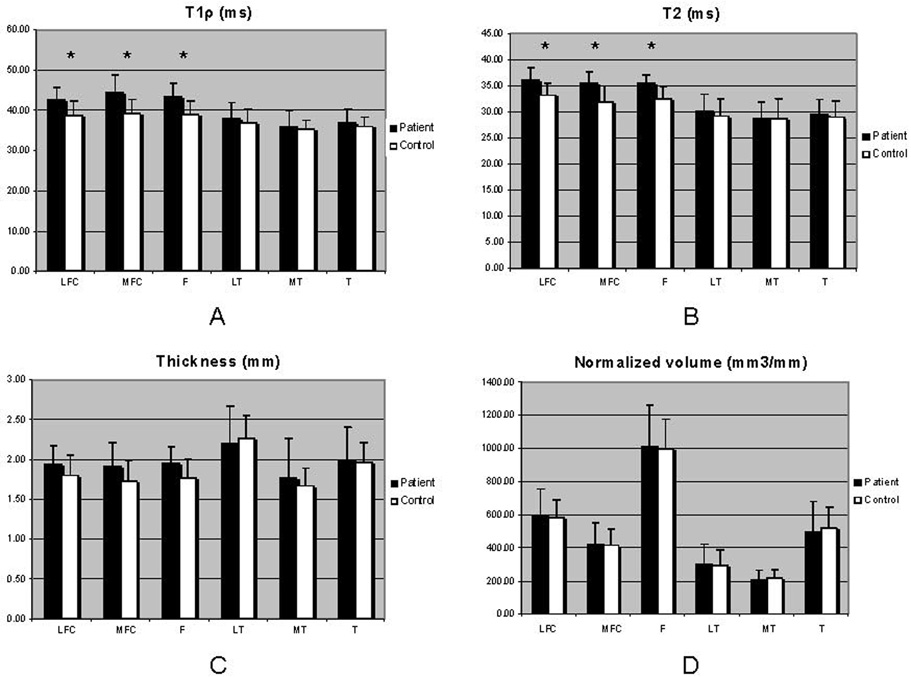
Results: Good measurement reproducibility was observed for bone parameters, the coefficients of variations (CVs) ranging from 1.8% for trabecular number (app. Tb.N) to 5.5% for trabecular separation (app. Tb.Sp). Significant differences between control and OA groups were found for bone volume fraction bone volume over total volume (app. BV/TV) and app. Tb.Sp in all compartments. Significantly increased values in T1rho and T2 were demonstrated in OA patients compared with controls at the femur, but not at the tibia. T1rho was negatively correlated with app. BV/TV, app. Tb.N and app. Tb.Sp both at the medial femoral condyle (MFC) and lateral tibia (LT), while T2 was only correlated at the LT. Also, medial tibia (MT) T1rho was negatively correlated with app. BV/TV (R(2)=-0.49, P<0.05) and app. Tb.N (R(2)=-0.42, P<0.05) from the opposite side of lateral femoral condyle (LFC). Significant correlations were found between trabecular bone parameters and cartilage thickness and normalized volume, mainly at LT, tibia (T) and femur (F).
Conclusion: At this early stage of OA, an overall decrease in bone structure parameters and an increase in cartilage parameters (T1rho, T2) were noticed in patients. Trabecular bone structure correlated with articular cartilage parameters suggesting that loss of mineralized bone is associated with cartilage degeneration.
Figures
Similar articles
-
Trabecular bone structure and spatial differences in articular cartilage MR relaxation times in individuals with posterior horn medial meniscal tears.Osteoarthritis Cartilage. 2013 Jan;21(1):86-93. doi: 10.1016/j.joca.2012.09.014. Epub 2012 Oct 6. Osteoarthritis Cartilage. 2013. PMID: 23047010 Free PMC article.
-
Osteoporotic changes of subchondral trabecular bone in osteoarthritis of the knee: a 3-T MRI study.Osteoporos Int. 2012 Feb;23(2):589-97. doi: 10.1007/s00198-011-1585-2. Epub 2011 Feb 26. Osteoporos Int. 2012. PMID: 21359670
-
Magnetic resonance imaging of normal and osteoarthritic trabecular bone structure in the human knee.Arthritis Rheum. 2002 Feb;46(2):385-93. doi: 10.1002/art.10108. Arthritis Rheum. 2002. PMID: 11840441 Clinical Trial.
-
MRI T2 and T1ρ relaxation in patients at risk for knee osteoarthritis: a systematic review and meta-analysis.BMC Musculoskelet Disord. 2019 May 1;20(1):182. doi: 10.1186/s12891-019-2547-7. BMC Musculoskelet Disord. 2019. PMID: 31039785 Free PMC article.
-
Systematic review and meta-analysis of the reliability and discriminative validity of cartilage compositional MRI in knee osteoarthritis.Osteoarthritis Cartilage. 2018 Sep;26(9):1140-1152. doi: 10.1016/j.joca.2017.11.018. Epub 2018 Mar 14. Osteoarthritis Cartilage. 2018. PMID: 29550400
Cited by
-
Abnormal tibial position is correlated to early degenerative changes one year following ACL reconstruction.J Orthop Res. 2015 Jul;33(7):1079-86. doi: 10.1002/jor.22867. Epub 2015 May 21. J Orthop Res. 2015. PMID: 25721417 Free PMC article.
-
Radiological diagnostic progress in skeletal diseases.Clin Cases Miner Bone Metab. 2011 Jan;8(1):13-6. Clin Cases Miner Bone Metab. 2011. PMID: 22461797 Free PMC article.
-
Medial tibial plateau sustaining higher physiological stress than the lateral plateau: based on 3D printing and finite element method.Biomed Eng Online. 2022 Sep 16;21(1):68. doi: 10.1186/s12938-022-01039-x. Biomed Eng Online. 2022. PMID: 36114576 Free PMC article.
-
Bone Remodeling in Osteoarthritis-Biological and Radiological Aspects.Medicina (Kaunas). 2023 Sep 7;59(9):1613. doi: 10.3390/medicina59091613. Medicina (Kaunas). 2023. PMID: 37763732 Free PMC article. Review.
-
Imaging of cartilage and bone: promises and pitfalls in clinical trials of osteoarthritis.Osteoarthritis Cartilage. 2014 Oct;22(10):1516-32. doi: 10.1016/j.joca.2014.06.023. Osteoarthritis Cartilage. 2014. PMID: 25278061 Free PMC article. Review.
References
-
- Beuf O, Ghosh S, Newitt DC, Link TM, Steinbach L, Ries M, et al. Magnetic resonance imaging of normal and osteoarthritic trabecular bone structure in the human knee. Arthritis Rheum. 2002;46:385–393. - PubMed
-
- Lindsey CT, Narasimhan A, Adolfo JM, Jin H, Steinbach LS, Link T, et al. Magnetic resonance evaluation of the interrelationship between articular cartilage and trabecular bone of the osteoarthritic knee. Osteoarthritis Cartilage. 2004;12:86–96. - PubMed
-
- Blumenkrantz G, Lindsey CT, Dunn TC, Jin H, Ries MD, Link TM, et al. A pilot, two-year longitudinal study of the interrelationship between trabecular bone and articular cartilage in the osteoarthritic knee. Osteoarthritis Cartilage. 2004;12:997–1005. - PubMed
-
- Buckwalter JA, Mankin HJ. Articular cartilage: degeneration and osteoarthritis, repair regeneration, and transplantation. Instr Course Lect. 1998;47:487–504. - PubMed
-
- Messent EA, Ward RJ, Tonkin CJ, Buckland-Wright C. Tibial cancellous bone changes in patients with knee osteoarthritis. A short-term longitudinal study using Fractal Signature Analysis. Osteoarthritis Cartilage. 2005;13:463–470. - PubMed
Publication types
MeSH terms
Grants and funding
LinkOut - more resources
Full Text Sources
Other Literature Sources
Medical
