. 2008 Apr 4;4(4):e1000050.
doi: 10.1371/journal.pcbi.1000050.

The statistical neuroanatomy of frontal networks in the macaque

Affiliations

The statistical neuroanatomy of frontal networks in the macaque

Bruno B Averbeck et al. PLoS Comput Biol. .

Abstract

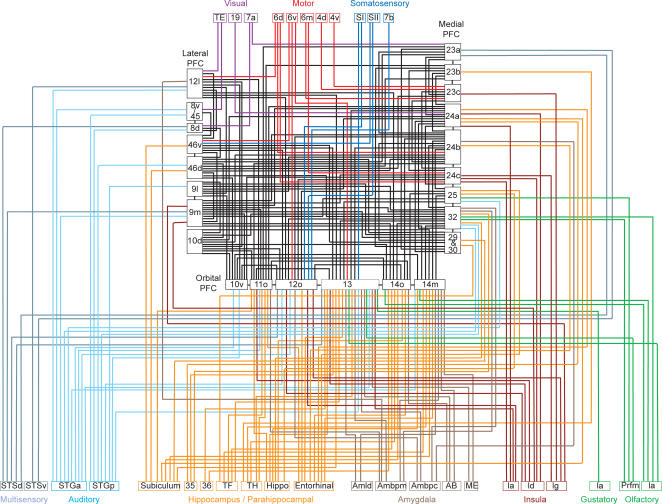
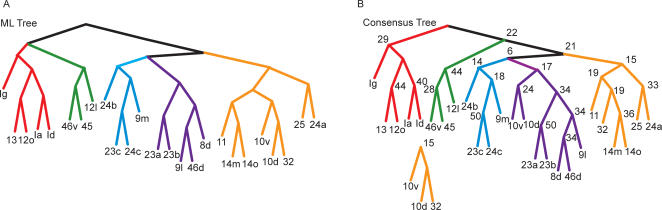
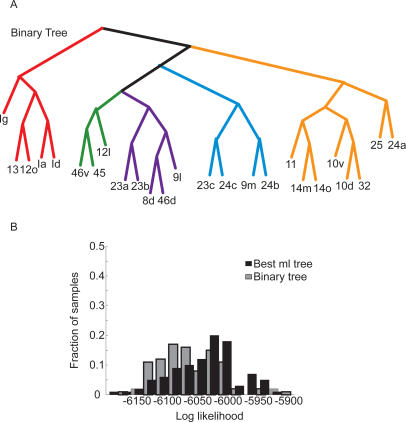
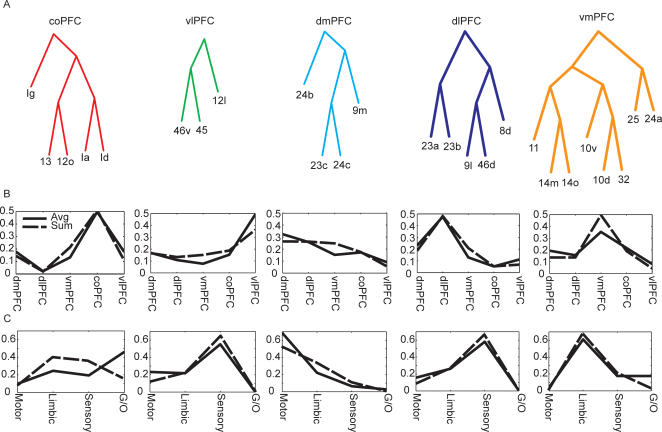
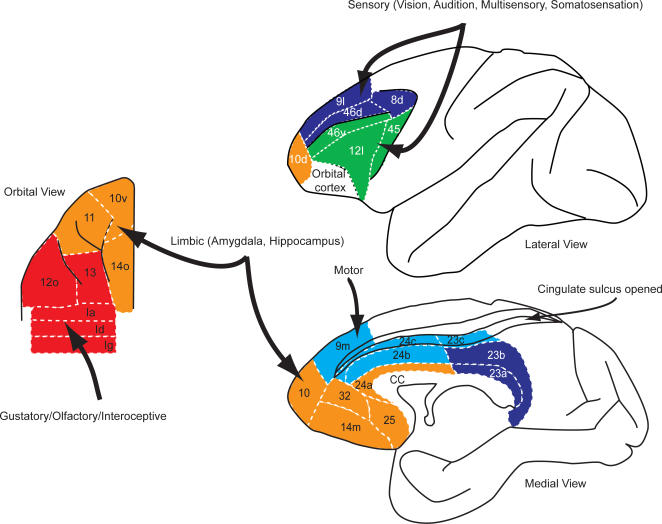
We were interested in gaining insight into the functional properties of frontal networks based upon their anatomical inputs. We took a neuroinformatics approach, carrying out maximum likelihood hierarchical cluster analysis on 25 frontal cortical areas based upon their anatomical connections, with 68 input areas representing exterosensory, chemosensory, motor, limbic, and other frontal inputs. The analysis revealed a set of statistically robust clusters. We used these clusters to divide the frontal areas into 5 groups, including ventral-lateral, ventral-medial, dorsal-medial, dorsal-lateral, and caudal-orbital groups. Each of these groups was defined by a unique set of inputs. This organization provides insight into the differential roles of each group of areas and suggests a gradient by which orbital and ventral-medial areas may be responsible for decision-making processes based on emotion and primary reinforcers, and lateral frontal areas are more involved in integrating affective and rational information into a common framework.


Conflict of interest statement

The authors have declared that no competing interests exist.

Figures

Figure 1
Figure 1. Connectivity diagram showing interconnections of frontal reward and decision-making networks with sensory, limbic, and motor systems.
In this diagram, for clarity, only intermediate and strong projections to the frontal cortex are shown.
Figure 2
Figure 2. Connectivity of frontal areas.
(A) Histogram showing count of areas with projections to the indicated number of areas. (B) Fraction of frontal areas that receive the signal from each modality as a function of the number of connectivity steps within frontal cortex. 0 indicates the areas which receive a direct projection from the indicated modality, and 1 indicates the fraction of areas that would receive the signal after a single step within frontal cortex. Mot, motor; Amy, amygdala; Hip, hippocampus; Vis, visual; SS, somatosensory; G/O, gustatory/olfactory; MS, multisensory; Aud, auditory.
Figure 3
Figure 3. Log likelihood of trees.
Distribution of log-likelihood values from 100 bootstrap datasets for most-likely tree, least most-likely (1001st) tree, and a random tree, generated by shuffling the leaves of the most likely tree.
Figure 4
Figure 4. Trees fit to the data.
(A) Most likely (ML) tree (highest likelihood), generated from boot-strap analysis. Colors indicate clusters into which we split the data for further analysis. (B) Consensus tree, generated from the 50 top most likely trees. Numbers at each branch point indicated how many times each cluster occurred in the 50 most likely trees. The detached cluster below the tree (10v,10d,32), which was part of ML tree, was not part of the consensus tree, although it occurred 15 times.
Figure 5
Figure 5. Fit of binary tree.
(A) Tree which best fit the binary data. (B) Comparison of fit of binary tree and tree fit to weighted data, on the weighted dataset.
Figure 6
Figure 6. Profile of inputs characterizing each cluster of areas.
(A) Clusters. (B) Intrinsic, frontal inputs. (C) Extrinsic inputs. All inputs were normalized to sum to 1. Thus, the line indicates the proportion of inputs coming from each modality.
Figure 7
Figure 7. Summary of clusters of prefrontal areas and their dominant inputs.
Figure 8
Figure 8. Distribution of connections and distances.
(A) Distribution of connection strengths in our dataset. (B) Distribution of distances.

References

    1. Felleman DJ, Van Essen DC. Distributed hierarchical processing in the primate cerebral cortex. Cereb Cortex. 1991;1:1–47. - PubMed
    1. Passingham RE, Stephan KE, Kotter R. The anatomical basis of functional localization in the cortex. Nat Rev Neurosci. 2002;3:606–616. - PubMed
    1. Stephan KE, Hilgetag CC, Burns GA, O'Neill MA, Young MP, et al. Computational analysis of functional connectivity between areas of primate cerebral cortex. Philos Trans R Soc Lond B Biol Sci. 2000;355:111–126. - PMC - PubMed
    1. Young MP. The organization of neural systems in the primate cerebral cortex. Proc Biol Sci. 1993;252:13–18. - PubMed
    1. Vezoli J, Falchier A, Jouve B, Knoblauch K, Young M, et al. Quantitative analysis of connectivity in the visual cortex: Extracting function from structure. Neuroscientist. 2004;10:476–482. - PubMed