. 2008 Apr 4;4(4):e1000037.
doi: 10.1371/journal.ppat.1000037.

Deciphering interplay between Salmonella invasion effectors

Affiliations

Deciphering interplay between Salmonella invasion effectors

Robert J Cain et al. PLoS Pathog. .

Abstract

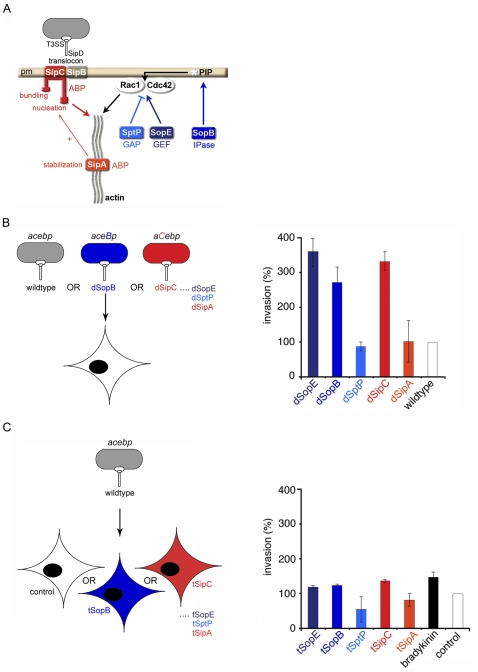
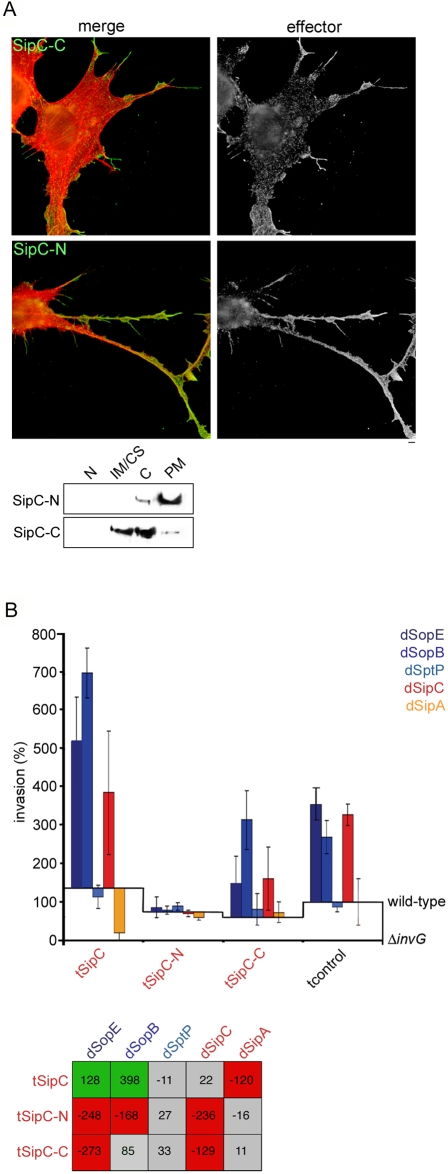
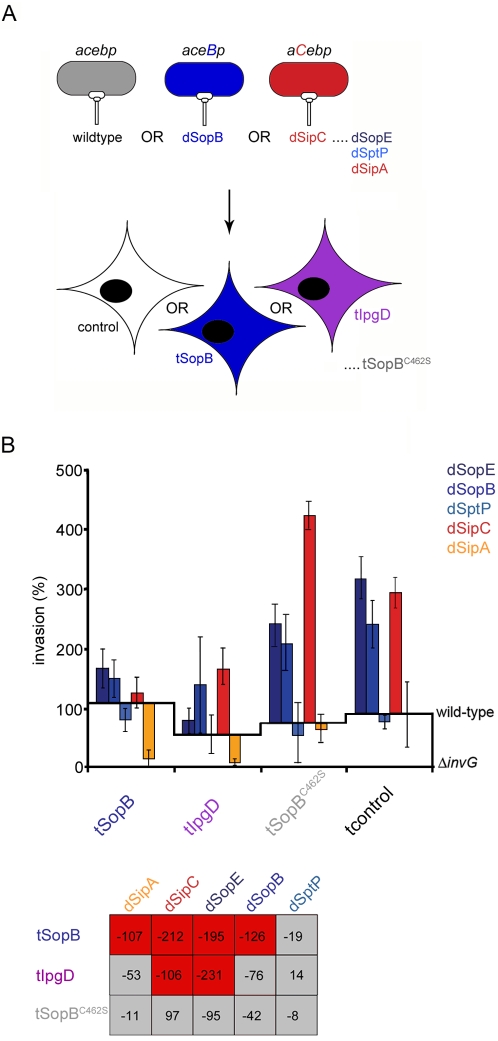
Bacterial pathogens have evolved a specialized type III secretion system (T3SS) to translocate virulence effector proteins directly into eukaryotic target cells. Salmonellae deploy effectors that trigger localized actin reorganization to force their own entry into non-phagocytic host cells. Six effectors (SipC, SipA, SopE/2, SopB, SptP) can individually manipulate actin dynamics at the plasma membrane, which acts as a 'signaling hub' during Salmonella invasion. The extent of crosstalk between these spatially coincident effectors remains unknown. Here we describe trans and cisbinary entry effector interplay (BENEFIT) screens that systematically examine functional associations between effectors following their delivery into the host cell. The results reveal extensive ordered synergistic and antagonistic relationships and their relative potency, and illuminate an unexpectedly sophisticated signaling network evolved through longstanding pathogen-host interaction.


Conflict of interest statement

The authors have declared that no competing interests exist.

Figures

Figure 1
Figure 1. Only T3SS-delivered effectors influence bacterial invasion rate.
A. Salmonella effectors that subvert host cytoskeletal dynamics. Effectors are delivered into the host cell via the type III secretion system (T3SS). Effector delivery requires Salmonella invasion proteins SipB and SipC, which form a plasma membrane-integral translocon likely linked to the T3SS by SipD. Two delivered effector Sips are actin-binding proteins (ABPs) that modulate actin dynamics: SipC nucleates actin polymerization and cross-links (bundles) actin filaments (F-actin) at the cell plasma membrane (pm), activities stimulated by SipA, which independently binds F-actin and inhibits filament depolymerization. Three further effectors are delivered into the cell via a SipB-SipC-dependent mechanism: the GDP-GTP exchange factor (GEF) SopE (or ubiquitous SopE2) activates Cdc42 and Rac1 Rho-family GTPases; the inositol polyphosphatase (IPase) SopB indirectly activates these GTPases and RhoG via inositol phosphate (PIP) hydrolysis; the antagonistic GTPase activating activity (GAP) and tyrosine phosphatase activities of SptP inactivate signaling after bacterial entry. B. Left: Schematic illustrating infection of cultured cells by wild-type or effector-augmented S.typhimurium strains. Wild-type bacteria endogenously express, secrete and deliver sipA, sipC, sopE, sopB and sptP (abbreviated to acebp). Effector-augmented strains each express, secrete and deliver mildly increased levels of an individual plasmid-encoded effector in the wild-type background [enhanced effector shown in capitals, e.g. aceBp (dSopB) and aCebp (dSipC) produce increased levels of SopB and SipC, respectively]. Right: Graph comparing relative cell invasion rates of wild-type and effector-augmented (denoted d-effector) S.typhimurium strains. Invasion was compared to wild-type after 60 min (assigned as 100%). Results are mean±SEM of 4 independent experiments each performed in triplicate. C. Left: Schematic illustrating infection of effector-transfected cells by S.typhimurium. Wild-type bacteria endogenously express, secrete and deliver sipA, sipC, sopE, sopB and sptP (abbreviated to acebp). Cultured cells were transfected with individual effectors prior to infection (denoted t-effector). Right: Graph comparing invasion of mock transfected (control), effector-transfected (t-effector) or bradykinin-treated cells by wild-type S.typhimurium. Invasion was compared to wild-type after 60 min (assigned as 100%). Results are mean±SEM of 4 independent experiments each performed in triplicate.
Figure 2
Figure 2. SipC-mediated invasion occurs independently of cellular Rho GTPases.
A. Schematic illustrating the infection of cells expressing dominant negative Rho-family GTPases by wild-type or effector-augmented S.typhimurium strains. Wild-type bacteria endogenously express, secrete and deliver sipA, sipC, sopE, sopB and sptP (abbreviated to acebp). Effector-augmented strains each express, secrete and deliver mildly increased levels of an individual plasmid-encoded effector in the wild-type background [enhanced effector shown in capitals, e.g. aceBp (dSopB) and aCebp (dSipC) produce increased levels of SopB and SipC, respectively]. Cultured cells were transfected with dominant negative Rho-family GTPases [Cdc42(N17), Rac1(N17), RhoA(N19)] prior to infection (denoted t-dominant negative GTPase). B. Cultured fibroblasts were transfected with dominant negative Rho-family GTPases [tCdc42(N17), tRac1(N17), tRhoA(N19)] prior to infection with wild-type or effector-augmented (d-effector) S.typhimurium strains. Invasion rates after 60 min were compared to wild-type (assigned as 100%). Results are mean±SEM of 4 independent experiments each performed in triplicate. Baselines ‘wild-type’ and ‘ΔinvG’ denote WT S.typhimurium SL1344 and S.typhimurium ΔinvG (T3SS deficient) invasion in each transfectant background, respectively. Table shows differences in invasion rates (%) after correction. Shading denotes a significant decrease (red) or no significant change (grey) in invasion rates (Mann Whitney U p<0.05).
Figure 3
Figure 3. Ordered effector interplay revealed by trans BENEFIT screening.
A. Schematic illustrating trans BENEFIT screening (the infection of cells expressing individual entry effectors by wild-type or effector-augmented S.typhimurium strains). Wild-type bacteria endogenously express, secrete and deliver sipA, sipC, sopE, sopB and sptP (abbreviated to acebp). Effector-augmented strains each express, secrete and deliver mildly increased levels of an individual plasmid-encoded effector in the wild-type background [enhanced effector shown in capitals, e.g. aceBp (dSopB) and aCebp (dSipC) produce increased levels of SopB and SipC, respectively]. Cultured cells were transfected with individual entry effectors (denoted t-effector) prior to infection. B. Cultured fibroblasts were transfected (t) with individual effectors prior to infection with wild-type or effector-augmented (d-effector) S.typhimurium strains. Invasion rates after 60 min were compared to wild-type (assigned as 100%). Results are mean±SEM of 4 independent experiments each performed in triplicate. Baselines ‘wild-type’ and ‘ΔinvG’ denote S.typhimurium SL1344 and S.typhimurium ΔinvG (T3SS deficient) invasion in each transfectant background, respectively. Table shows differences in invasion rates (%) after correction. Shading denotes a significant increase (green), significant decrease (red) or no significant change (grey) in invasion (Mann Whitney U p<0.05).
Figure 4
Figure 4. Sip-Sop synergy revealed by cis BENEFIT screening.
A. Schematic illustrating cis BENEFIT screening. Pair-wise combinations of effector-augmented (d-effector) S.typhimurium strains [enhanced effector shown in capitals, e.g. aceBp (dSopB) and aCebp (dSipC) produce increased levels of SopB and SipC, respectively] were mixed 50∶50 (overall MOI 50), where one strain additionally carries spectinomycin resistance (SpR). The mixed inoculum is used to infect cultured cells, and a reciprocal infection performed in parallel in which the opposing strain is spectinomycin resistant. After infection (60 min), extracellular bacteria are killed with gentamicin and infected cell lysate dilutions replica plated on LB agar (depicted white) and LB containing spectinomycin (grey). Overall invasion rate and invasion of the spectinomycin resistant strain are calculated by scoring colony-forming units. The invasion rate of the strain lacking the marker is calculated by subtracting invasion of the spectinomycin resistant strain from the overall value (X1, Y2). To correct for the mild influence of spectinomycin on invasion efficiency, invasion rates of individual strains are averaged with the parallel experiment i.e. [X1+X2 Sp]÷2 = X and [Y1+Y2 Sp]÷2 = Y. Each pair of infections were performed 4 times in triplicate. B. S.typhimurium SL1344 or effector-augmented (d-effector) strains were mixed pair wise (50∶50; MOI 50) for infection. Invasion of each strain was assessed using selectable markers after 60 min (Figure 4A). Results are the mean of four independent experiments each performed in triplicate Upper: Pie charts depict total invasion by each combination (size; combined %) and relative contribution of each strain (division; %). Lower: Tables show difference (%) in total invasion rate (left) and relative invasion rate of each strain (right) after correction. Shading denotes a significant increase (green) or no significant change (grey) in invasion rate (Mann Whitney U p<0.05).
Figure 5
Figure 5. Membrane localization of the C-terminal SipC actin-nucleation domain is required for synergy with SopB.
A. Localization of SipC derivatives expressed in cultured cells. Upper: Immunofluorescence micrographs of fixed NIH3T3 cells transiently expressing SipC-C or SipC-N. Left column shows merged double immunofluorescence (merge) of cells stained 48 h after transfection with anti-FLAG IgG/AlexaFluor 488-conjugated anti-mouse IgG to localise SipC derivatives (green) and Texas Red-conjugated phalloidin to visualize F-actin (red). Effector channel alone is shown in greyscale for clarity (effector). Images are representative of >100 cells from three independent experiments. Scale bars, 2 µm. Lower: Cultured NIH3T3 cells were transiently transfected with expression vectors encoding SipC-C or SipC-N. After 48 h transfectants were mechanically fractionated, and each subfraction [nuclei (N), internal membranes/cytoskeleton (IM/CS), cytoplasm (C), plasma membrane (PM)] analyzed by immunoblotting with anti-SipC polyclonal antibody. B. Cultured fibroblasts were transfected (t) with SipC or derivatives SipC-N or SipC-C prior to infection with wild-type or effector-augmented (d-effector) S.typhimurium strains. Invasion rates after 60 min were compared to wild-type (assigned as 100%). Results are mean±SEM of 4 independent experiments each performed in triplicate. Baselines ‘wild-type’ and ‘ΔinvG’ denote S.typhimurium SL1344 and S.typhimurium ΔinvG (T3SS deficient) invasion in each transfectant background, respectively. Table shows differences in invasion rates (%) after correction. Shading denotes a significant increase (green), significant decrease (red) or no significant change (grey) in invasion (Mann Whitney U p<0.05).
Figure 6
Figure 6. SopB inositol phosphatase activity is required for inhibition of Salmonella entry.
A. Schematic illustrating the infection of cells expressing SopB, catalytically inactive SopBC462S or the Shigella inositol phosphatase IpgD with wild-type or effector-augmented S.typhimurium strains. Wild-type bacteria endogenously express, secrete and deliver sipA, sipC, sopE, sopB and sptP (abbreviated to acebp). Effector-augmented strains each express, secrete and deliver mildly increased levels of an individual plasmid-encoded effector in the WT background [enhanced effector shown in capitals, e.g. aceBp (dSopB) and aCebp (dSipC) produce increased levels of SopB and SipC, respectively]. Cultured cells were transfected with individual entry effectors or effector derivatives (denoted t-effector) prior to infection. B. Cultured fibroblasts were transfected (t) with SopB, a catalytically inactive SopBC462S derivative, or the Shigella inositol phosphatase IpgD prior to infection with wild-type or effector-augmented (d-effector) S.typhimurium strains. Invasion rates after 60 min were compared to wild-type (assigned as 100%). Results are mean±SEM of 4 independent experiments each performed in triplicate. Baselines ‘wild-type’ and ‘ΔinvG’ denote S.typhimurium SL1344 and S.typhimurium invG (T3SS deficient) invasion in each transfectant background, respectively. Table shows differences in invasion rates (%) after correction. Shading denotes a significant increase (green), significant decrease (red) or no significant change (grey) in invasion (Mann Whitney U p<0.05).
Figure 7
Figure 7. SopB inositol phosphatase activity is required for synergy with SipC during Salmonella entry.
A. Schematic illustrating trans BENEFIT screening to investigate the role of SopB inositol phosphatase activity. Wild-type bacteria endogenously express, secrete and deliver sipA, sipC, sopE, sopB and sptP (abbreviated to acebp). Effector-augmented strains each express, secrete and deliver mildly increased levels of an individual plasmid-encoded effector in the wild-type background [enhanced effector shown in capitals, e.g. in this assay aceBp (dSopB), aceBC462Sp (dSopBC462S) and acEbp (dSopE) that produce increased levels of SopB, catalytically inactive SopBC462S or SopE, respectively]. Cultured cells were transfected with individual entry effectors (denoted t-effector) prior to infection. B. Cultured fibroblasts were transfected (t) with individual effectors prior to infection with wild-type or effector-augmented (d-effector) S.typhimurium strains. In this assay dSopE, dSopB and dSopBC462S strains were examined. Invasion rates after 60 min were compared to wild-type (assigned as 100%). Results are typical of those obtained in two independent experiments each performed in triplicate. Baselines ‘wild-type’ and ‘ΔinvG’ denote S.typhimurium SL1344 and S.typhimurium ΔinvG (T3SS deficient) invasion in each transfectant background, respectively. Table shows differences in invasion rates (%) after correction. Shading denotes a significant increase (green), significant decrease (red) or no significant change (grey) in invasion (Mann Whitney U p<0.05).
Figure 8
Figure 8. SipC-dependent relocalization of phosphatidylinositol-4,5-bisphosphate (PI45P2) drives synergy with SopB.
A. Fibroblasts were transfected with cellular phosphatidylinositol-4-phosphate-5-kinase (tPIP(5)K) prior to infection with wild-type or effector-augmented (d-effector) S.typhimurium strains. Invasion rates after 60 min were compared to wild-type (assigned as 100%). Results are mean±SEM of 4 independent experiments each performed in triplicate. Baselines ‘wild-type’ and ‘ΔinvG’ denote S.typhimurium SL1344 and S.typhimurium ΔinvG (T3SS deficient) invasion in each transfectant background, respectively. Table shows differences in invasion rates (%) after correction. Shading denotes a significant increase (green), significant decrease (red) or no significant change (grey) in invasion (Mann Whitney U p<0.05). B. Graph showing relative change (compared to mock transfected control cells) in concentration of specific phosphatidylinositol species [PI(3,4,5)P3, phosphatidylinositol-3,4,5-trisphosphate; PI(4,5)P2, phosphatidylinositol-4,5-bisphosphate; PI(3,4)P2, phosphatidylinositol-3,4-bisphosphate; PI(3,5)P2, phosphatidylinositol-3,5-bisphosphate; PI(5)P, phosphatidylinositol-5-phosphate; PI(4)P, phosphatidylinositol-4-phosphate; PI(3)P, phosphatidylinositol-3-phosphate) in transfectants expressing SptP, SopB and SipC following HPLC analysis of radiolabelled fibroblasts. Data shown are representative of those obtained in two independent labelling experiments. C. Immunofluorescence micrographs of NIH3T3 cells expressing PLCδ-PH-GFP fixed after infection (60 min) with S.typhimurium strains engineered to express augmented levels of SopB, SopE or SipC. Left column shows merged triple immunofluorescence (merge) of cells stained with Texas Red-conjugated phalloidin to visualize F-actin (red) and DAPI to visualize cell nuclei and bacteria (blue, internalized bacteria indicated with arrows). GFP fluorescence was visualized directly. Actin (F-actin) and PLCδ-PH-GFP channels are also shown in greyscale for clarity. Images are representative of >100 cells from independent experiments. Scale bars, 2 µm.
Figure 9
Figure 9. Interplay between delivered Salmonella entry effectors.
Schematic summary of the synergistic (green arrows) and antagonistic (red arrow) relationships between delivered Salmonella invasion effectors revealed by BENEFIT screening. Arrow width depicts relative magnitude of functional cooperativity. Abbreviations, ABP (actin-binding protein), GEF (GTPase exchange factor), IPase (inositol phosphatase), GAP (GTPase activating protein).

References

    1. Galan JE, Wolf-Watz H. Protein delivery into eukaryotic cells by type III secretion machines. Nature. 2006;444:567–573. - PubMed
    1. Finlay BB, Falkow S. Salmonella interactions with polarized human intestinal Caco-2 epithelial cells. J Infect Dis. 1990;162:1096–1106. - PubMed
    1. Patel JC, Galan JE. Manipulation of the host actin cytoskeleton by Salmonella–all in the name of entry. Curr Opin Microbiol. 2005;8:10–15. - PubMed
    1. Collazo CM, Galan JE. The invasion-associated type III system of Salmonella typhimurium directs the translocation of Sip proteins into the host cell. Mol Microbiol. 1997;24:747–756. - PubMed
    1. Hayward RD, Cain RJ, McGhie EJ, Phillips N, Garner MJ, et al. Cholesterol binding by the bacterial type III translocon is essential for virulence effector delivery into mammalian cells. Mol Microbiol. 2005;56:590–603. - PubMed

Publication types

MeSH terms