

Activation drives PD-1 expression during vaccine-specific proliferation and following lentiviral infection in macaques
- PMID: 18389475
- PMCID: PMC2996615
- DOI: 10.1002/eji.200737857
Activation drives PD-1 expression during vaccine-specific proliferation and following lentiviral infection in macaques
Abstract
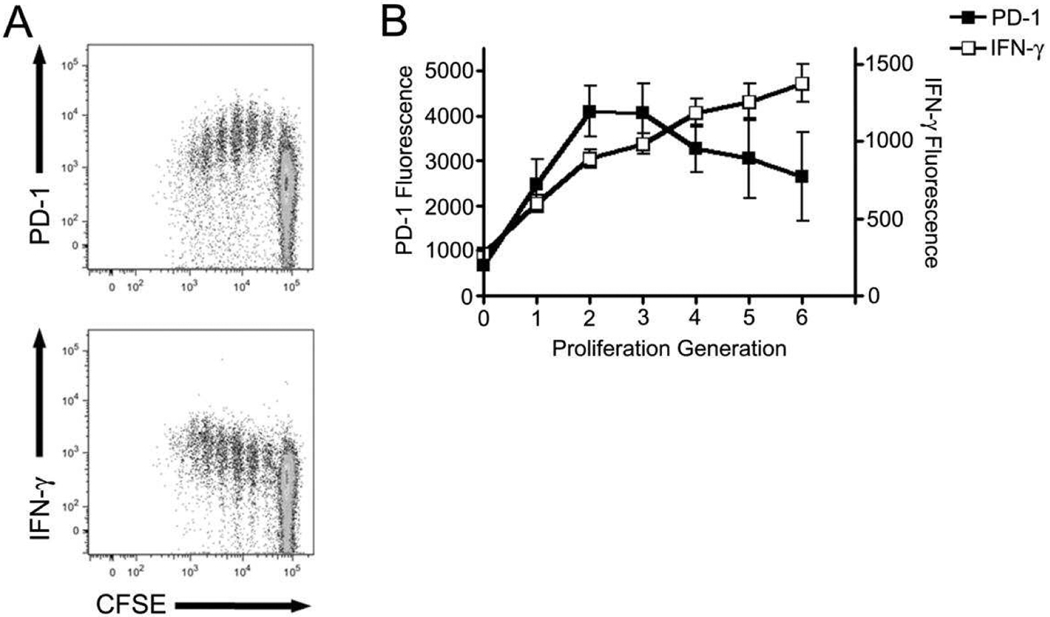
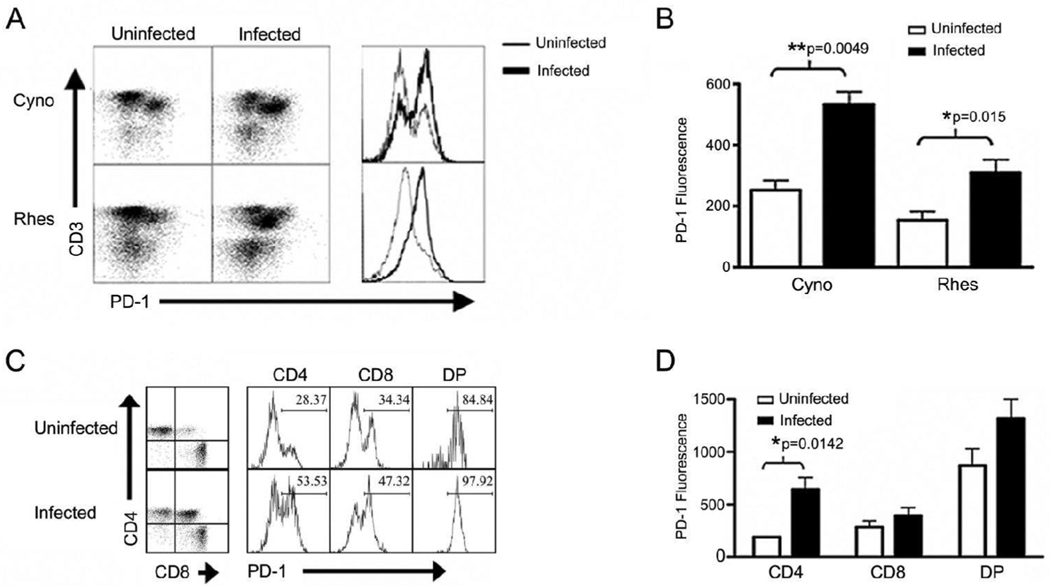
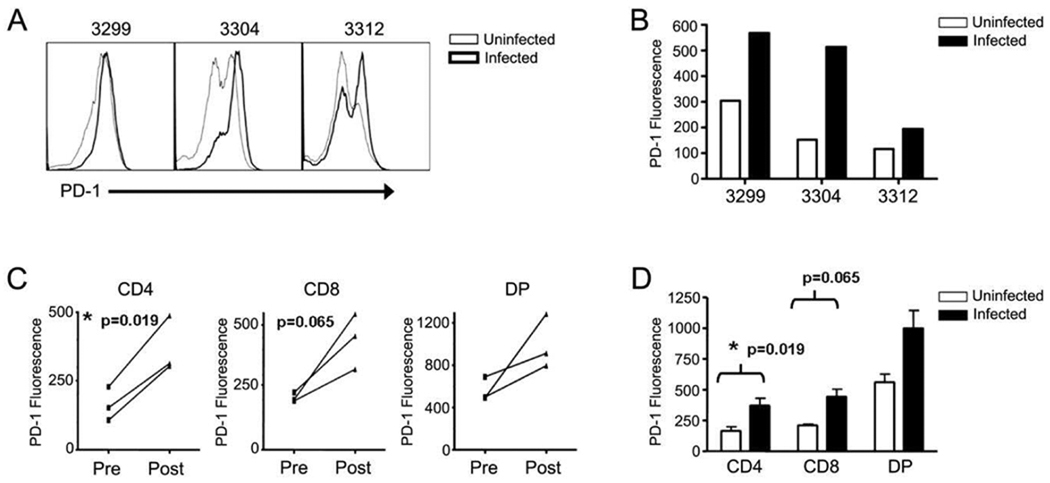
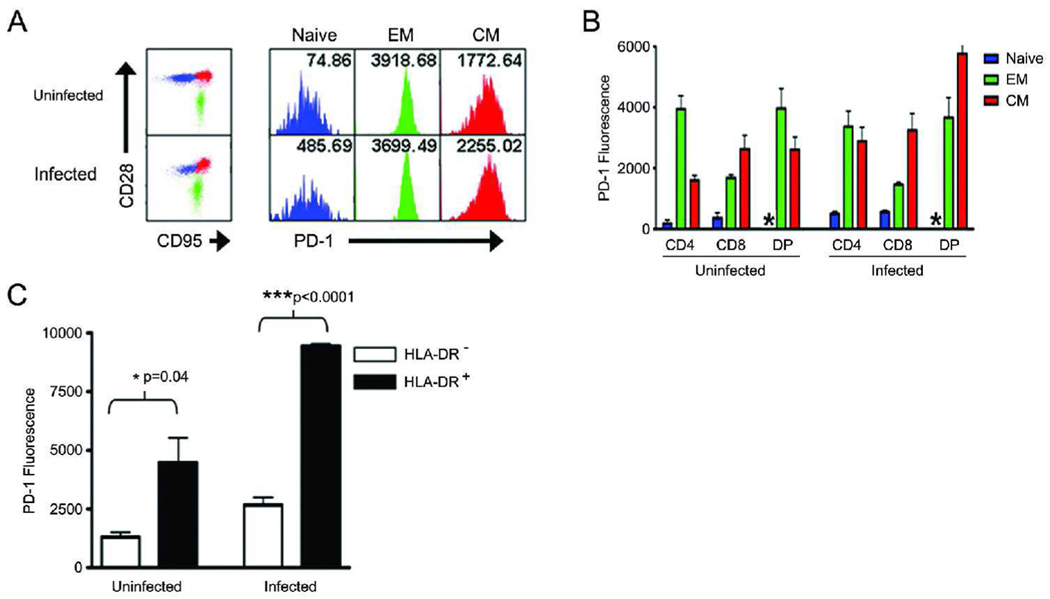
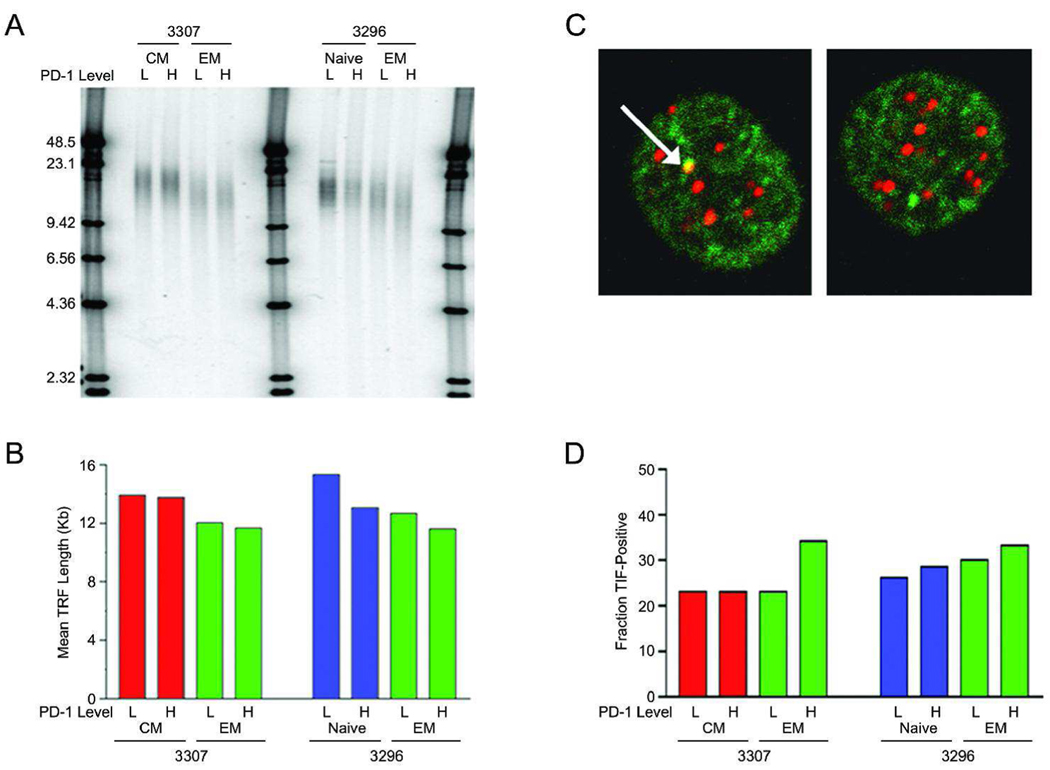
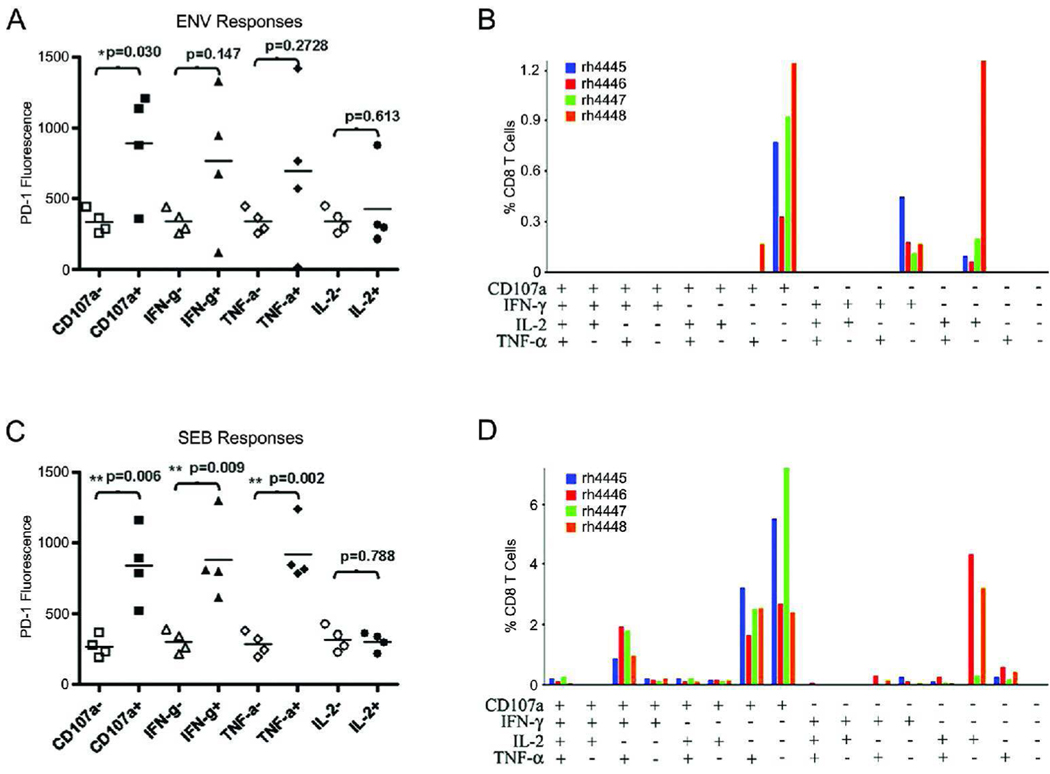
Recent data supports that increased expression of PD-1, a negative regulator of immune function, is associated with T cell exhaustion during chronic viral infection. However, PD-1 expression during acute infection and vaccination has not been studied in great detail in primates. Here, we examine PD-1 expression on CD3(+) T cells following DNA vaccination or lentiviral infection of macaques. Ex vivo peptide stimulation of PBMC from DNA-vaccinated uninfected macaques revealed a temporal increase in PD-1 expression in proliferating antigen-specific CD8(+) T cells. Following the initial increase, PD-1 expression steadily declined as proliferation continued, with a concomitant increase in IFN-gamma secretion. Subsequent examination of PD-1 expression on T cells from uninfected and lentivirus-infected non-vaccinated macaques revealed a significant increase in PD-1 expression with lentiviral infection, consistent with previous reports. PD-1 expression was highest on cells with activated memory and effector phenotypes. Despite their decreased telomere length, PD-1(hi) T cell populations do not appear to have statistically significant uncapped telomeres, typically indicative of proliferative exhaustion, suggesting a different mechanistic regulation of proliferation by PD-1. Our data indicate that PD-1 expression is increased as a result of T cell activation during a primary immune response as well as during persistent immune activation in macaques.
Conflict of interest statement
There are no conflicts of interest for this manuscript.
Figures
Similar articles
-
Containment of simian immunodeficiency virus infection in vaccinated macaques: correlation with the magnitude of virus-specific pre- and postchallenge CD4+ and CD8+ T cell responses.J Immunol. 2002 Nov 1;169(9):4778-87. doi: 10.4049/jimmunol.169.9.4778. J Immunol. 2002. PMID: 12391187
-
Therapeutic vaccination with simian immunodeficiency virus (SIV)-DNA + IL-12 or IL-15 induces distinct CD8 memory subsets in SIV-infected macaques.J Immunol. 2008 Jun 15;180(12):7969-79. doi: 10.4049/jimmunol.180.12.7969. J Immunol. 2008. PMID: 18523260 Clinical Trial.
-
Loss of effector and anti-inflammatory natural killer T lymphocyte function in pathogenic simian immunodeficiency virus infection.PLoS Pathog. 2012 Sep;8(9):e1002928. doi: 10.1371/journal.ppat.1002928. Epub 2012 Sep 20. PLoS Pathog. 2012. PMID: 23028326 Free PMC article.
-
Elevated expression levels of inhibitory receptor programmed death 1 on simian immunodeficiency virus-specific CD8 T cells during chronic infection but not after vaccination.J Virol. 2007 Jun;81(11):5819-28. doi: 10.1128/JVI.00024-07. Epub 2007 Mar 21. J Virol. 2007. PMID: 17376899 Free PMC article.
-
Revisiting immune exhaustion during HIV infection.Curr HIV/AIDS Rep. 2011 Mar;8(1):4-11. doi: 10.1007/s11904-010-0066-0. Curr HIV/AIDS Rep. 2011. PMID: 21188556 Free PMC article. Review.
Cited by
-
Low Levels of T Cell Exhaustion in Tuberculous Lung Granulomas.Infect Immun. 2018 Aug 22;86(9):e00426-18. doi: 10.1128/IAI.00426-18. Print 2018 Sep. Infect Immun. 2018. PMID: 29891540 Free PMC article.
-
Immunodominant Dengue Virus-Specific CD8+ T Cell Responses Are Associated with a Memory PD-1+ Phenotype.J Virol. 2016 Apr 14;90(9):4771-4779. doi: 10.1128/JVI.02892-15. Print 2016 May. J Virol. 2016. PMID: 26912627 Free PMC article.
-
Blocking of PDL-1 interaction enhances primary and secondary CD8 T cell response to herpes simplex virus-1 infection.PLoS One. 2012;7(7):e39757. doi: 10.1371/journal.pone.0039757. Epub 2012 Jul 12. PLoS One. 2012. PMID: 22808056 Free PMC article.
-
Minor antigen distribution predicts site-specific graft-versus-tumor activity of adoptively transferred, minor antigen-specific CD8 T Cells.Biol Blood Marrow Transplant. 2014 Jan;20(1):26-36. doi: 10.1016/j.bbmt.2013.10.009. Epub 2013 Oct 17. Biol Blood Marrow Transplant. 2014. PMID: 24141010 Free PMC article.
-
HPV16 E7 DNA tattooing: safety, immunogenicity, and clinical response in patients with HPV-positive vulvar intraepithelial neoplasia.Cancer Immunol Immunother. 2017 Sep;66(9):1163-1173. doi: 10.1007/s00262-017-2006-y. Epub 2017 Apr 27. Cancer Immunol Immunother. 2017. PMID: 28451790 Free PMC article. Clinical Trial.
References
-
- Barber DL, Wherry EJ, Masopust D, Zhu B, Allison JP, Sharpe AH, Freeman GJ, et al. Restoring function in exhausted CD8 T cells during chronic viral infection. Nature. 2006;439:682–687. - PubMed
-
- Day CL, Kaufmann DE, Kiepiela P, Brown JA, Moodley ES, Reddy S, Mackey EW, et al. PD-1 expression on HIV-specific T cells is associated with T-cell exhaustion and disease progression. Nature. 2006;443:350–354. - PubMed
-
- Trautmann L, Janbazian L, Chomont N, Said EA, Gimmig S, Bessette B, Boulassel MR, et al. Upregulation of PD-1 expression on HIV-specific CD8+ T cells leads to reversible immune dysfunction. Nat Med. 2006;12:1198–1202. - PubMed
-
- Hokey DA, Weiner DB. DNA vaccines for HIV: challenges and opportunities. Springer Semin Immunopathol. 2006;28:267–279. - PubMed
Publication types
MeSH terms
Substances
Grants and funding
LinkOut - more resources
Full Text Sources
Other Literature Sources
Research Materials
