. 2008 Aug;95(4):2009-16.
doi: 10.1529/biophysj.108.128751. Epub 2008 Apr 4.

Investigating intracellular dynamics of FtsZ cytoskeleton with photoactivation single-molecule tracking

Affiliations

Investigating intracellular dynamics of FtsZ cytoskeleton with photoactivation single-molecule tracking

Lili Niu et al. Biophys J. 2008 Aug.

Abstract

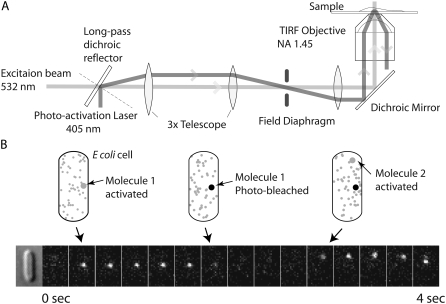
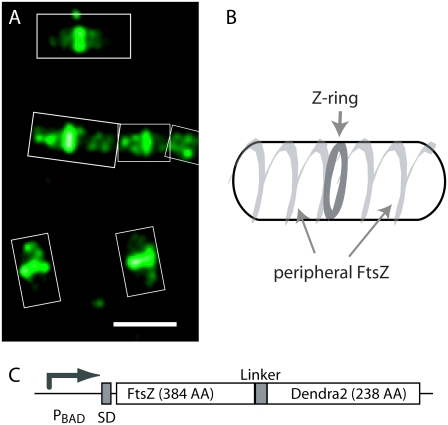
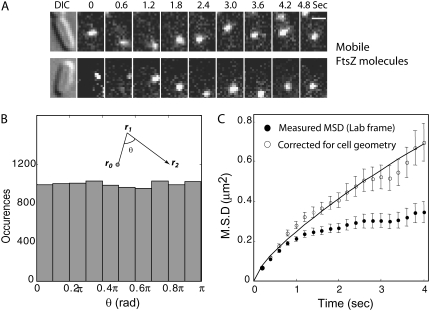
Using photoactivatable fluorescent protein as an intracellular protein label for single-molecule tracking offers several advantages over the traditional methods. Here we demonstrate the technique of photoactivation single-molecule tracking by investigating the mobility dynamics of intracellular FtsZ protein molecules in live Escherichia coli cells. FtsZ is a prokaryotic cytoskeleton protein (a homolog of tubulin) and plays important roles in cytokinesis. We demonstrate two heterogeneous subpopulations of FtsZ molecules with distinct diffusional dynamics. The FtsZ molecules forming the Z-rings near the center of the cell were mostly stationary, consistent with the assumption that they are within polymeric filamentous structures. The rest of the FtsZ molecules, on the other hand, undergo Brownian motion spanning the whole cell length. Surprisingly, the diffusion of FtsZ is spatially restricted to helical-shaped regions, implying an energy barrier for free diffusion. Consistently, the measured mean-square displacements of FtsZ showed anomalous diffusion characteristics. These results demonstrated the feasibility and advantages of photoactivation single-molecule tracking, and suggested new levels of complexity in the prokaryotic membrane organization.


Figures

FIGURE 1
FIGURE 1
Principle of the photoactivation single-molecule tracking method. (A) The microscope setup. The photoactivation laser excites the sample under TIR condition. The fluorescence excitation laser illuminates the whole depth of the sample. (B) A segment of the fluorescence trajectory taken from E. coli cells expressing FtsZ-Dendra2 chimeric protein. The unactivated molecules are illustrated in gray, the activated in red, and the photobleached in black. The first image in the time-series is the differential interference contrast (DIC) image. The rest are fluorescence images shown every 400 ms. The scale bar represents 1 μm.
FIGURE 2
FIGURE 2
Localization of FtsZ-Dendra2 proteins in E. coli cells. (A) Green fluorescence from the unactivated proteins in E. coli cells. Each cell is highlighted by the rectangular boxes. The scale bar represents 2 μm. (B) A schematic representation of the FtsZ localization pattern observed in literature using fluorescence microscopy. The central dark ring represents the Z-ring. The helix represents the FtsZ molecules outside the Z-ring. (C) Chimeric construct of ftsZ-dendra2 expression. SD, Shine-Dalgarno sequence.
FIGURE 3
FIGURE 3
The distribution of single FtsZ-Dendra2 molecules' stepping sizes at 200-ms time-interval. The results showed two distinct populations. The solid curves are least-square fitting of the distribution to the function form of formula image The first term represented the stationary population of the molecules. The second represented the mobile population. The two terms of the equation are plotted separately for clarity.
FIGURE 4
FIGURE 4
Distribution of the single molecule photobleaching times. Histogram of FtsZ-Dendra2 photobleaching time is measured from >3000 molecules under excitation density of 450 W/cm2. The straight line represented the single exponential fit of the histogram.
FIGURE 5
FIGURE 5
Single-molecule trajectories of stationary FtsZ molecules. (A) Two examples of fluorescence timelapse images of the stationary FtsZ single molecules shown at 600-ms interval. The first frame shows the DIC images of the cell. (B) Spatial distribution of the stationary FtsZ molecules within the cell. Most of the stationary FtsZ molecules are located at the center of the cell. (C) Mean-square displacement of stationary FtsZ molecules calculated from ∼800 trajectories showing a constant number representing the measurement noise.
FIGURE 6
FIGURE 6
Single-molecule trajectories of mobile FtsZ molecules. (A) Two examples of timelapse images of the mobile FtsZ single molecules shown at 600 ms interval. The first frame shows the DIC images of the cell. (B) The distribution of the angles between two consecutive displacement steps from a mobile FtsZ molecule. The histogram shows a uniform distribution between 0 and π, suggesting that treadmilling is of little effect in driving the movement of FtsZ. (C) MSD of mobile FtsZ molecules calculated from >2000 trajectories. The raw measurements in lab coordinates are plotted in solid circles. The corrected MSD based on computer simulation is plotted in open circles. The solid line is the best fit to the anomalous diffusion model.
FIGURE 7
FIGURE 7
Helical spatial pattern of the mobile FtsZ molecules. (A) Schemes illustrating the process for obtained overlay images from single molecule data. (B and C) Images of cells obtained by overlaying many single-molecule images of the mobile FtsZ molecules from the same cell. The images showed spiral-shaped patterns indicating the diffusion of FtsZ is limited to these regions. (D and E) Images of cells obtained by overlaying Gaussian spots of 300 nm, which are placed at the same centroid positions of detected single mobile FtsZ molecules. Each image is constructed from >300 single-molecule images collected within a timespan of 3 min.

References

    1. Deich, J., E. M. Judd, H. H. McAdams, and W. E. Moerner. 2004. Visualization of the movement of single histidine kinase molecules in live Caulobacter cells. Proc. Natl. Acad. Sci. USA. 101:15921–15926. - PMC - PubMed
    1. Douglass, A. D., and R. D. Vale. 2005. Single-molecule microscopy reveals plasma membrane microdomains created by protein-protein networks that exclude or trap signaling molecules in T cells. Cell. 121:937–950. - PMC - PubMed
    1. Elf, J., G. W. Li, and X. S. Xie. 2007. Probing transcription factor dynamics at the single-molecule level in a living cell. Science. 316:1191–1194. - PMC - PubMed
    1. Harms, G. S., L. Cognet, P. H. Lommerse, G. A. Blab, and T. Schmidt. 2001. Autofluorescent proteins in single-molecule research: applications to live cell imaging microscopy. Biophys. J. 80:2396–2408. - PMC - PubMed
    1. Ober, R. J., C. Martinez, X. Lai, J. Zhou, and E. S. Ward. 2004. Exocytosis of IgG as mediated by the receptor, FcRn: an analysis at the single-molecule level. Proc. Natl. Acad. Sci. USA. 101:11076–11081. - PMC - PubMed

Publication types

MeSH terms