

Nanoparticles as fluorescence labels: is size all that matters?
- PMID: 18390610
- PMCID: PMC2440474
- DOI: 10.1529/biophysj.107.127688
Nanoparticles as fluorescence labels: is size all that matters?
Abstract
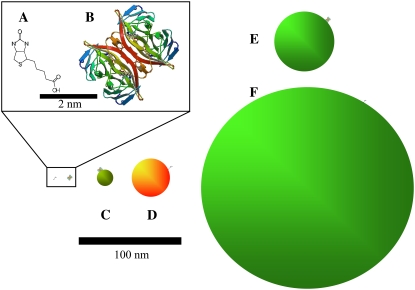
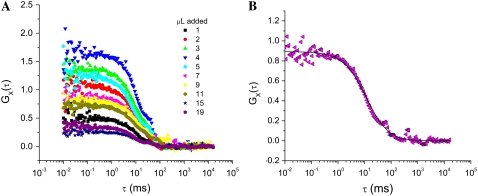
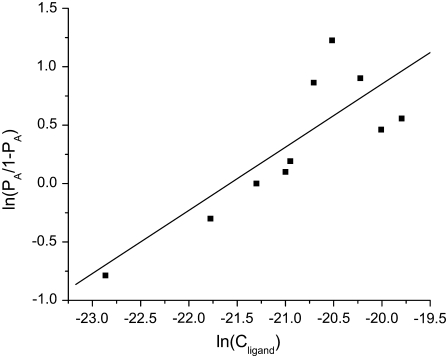
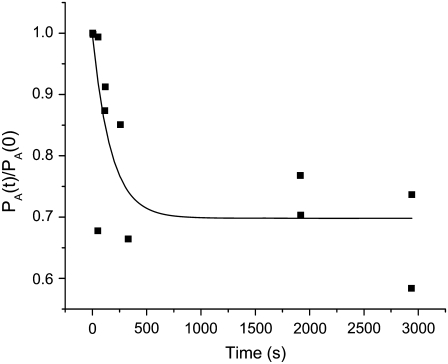
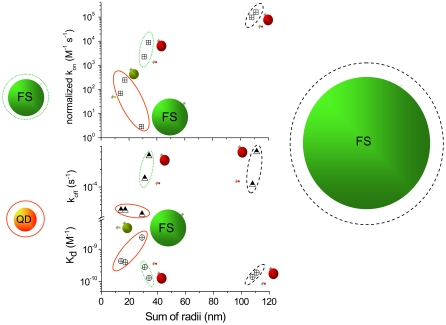
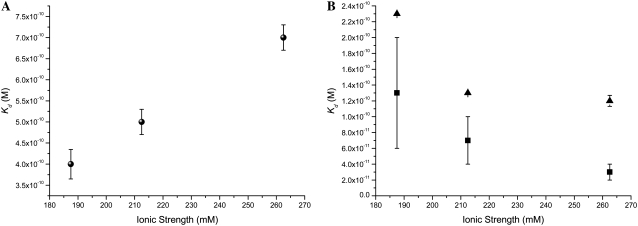
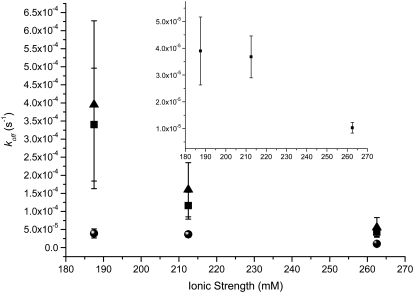
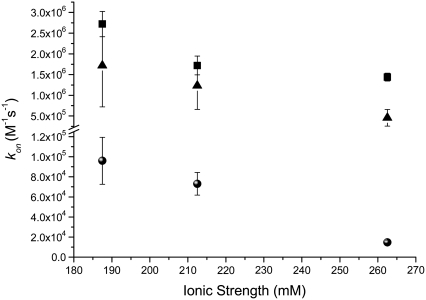
Fluorescent labels are often used in bioassays as a means to detect and characterize ligand-receptor binding. This is due in part to the inherently high sensitivity of fluorescence-based technology and the relative accessibility of the technique. There is often little concern raised as to whether or not the fluorescent label itself affects the ligand-receptor binding dynamics and equilibrium. This may be particularly important when considering nanoparticle labels. In this study, we examine the affects of nanoparticle (quantum dots and polymer nanospheres) fluorescent labels on the streptavidin-biotin binding system. Since the nanoparticle labels are larger than the species they tag, one could anticipate significant perturbation of the binding equilibrium. We demonstrate, using fluorescence cross-correlation spectroscopy, that although the binding equilibria do change, the relative changes are largely predictable. We suggest that the nanoparticles' mesoscopic size and surface tension effects can be used to explain changes in streptavidin-biotin binding.
Figures
Similar articles
-
A two-photon excitation fluorescence cross-correlation assay for a model ligand-receptor binding system using quantum dots.Biophys J. 2006 Feb 15;90(4):1396-410. doi: 10.1529/biophysj.105.069526. Epub 2005 Nov 18. Biophys J. 2006. PMID: 16299079 Free PMC article.
-
Silicon nanoparticle based fluorescent biological label via low temperature thermal degradation of chloroalkylsilane.Nanoscale. 2013 Jul 7;5(13):5732-7. doi: 10.1039/c3nr00932g. Epub 2013 May 28. Nanoscale. 2013. PMID: 23715596
-
Functionalized fluorescent core-shell nanoparticles used as a fluorescent labels in fluoroimmunoassay for IL-6.Biosens Bioelectron. 2007 May 15;22(11):2743-8. doi: 10.1016/j.bios.2007.01.022. Epub 2007 Feb 6. Biosens Bioelectron. 2007. PMID: 17360175
-
Time-Resolved Fluorescence Spectroscopy and Fluorescence Lifetime Imaging Microscopy for Characterization of Dendritic Polymer Nanoparticles and Applications in Nanomedicine.Molecules. 2016 Dec 24;22(1):17. doi: 10.3390/molecules22010017. Molecules. 2016. PMID: 28029135 Free PMC article. Review.
-
Nanoparticle fluorescence based technology for biological applications.J Nanosci Nanotechnol. 2008 Mar;8(3):1019-51. doi: 10.1166/jnn.2008.301. J Nanosci Nanotechnol. 2008. PMID: 18468106 Review.
Cited by
-
A self-assembling peptide hydrogel for ultrarapid 3D bioassays.Nanoscale Adv. 2018 Oct 22;1(2):490-497. doi: 10.1039/c8na00158h. eCollection 2019 Feb 12. Nanoscale Adv. 2018. PMID: 36132256 Free PMC article.
-
Protein-modified nanomaterials: emerging trends in skin wound healing.Discov Nano. 2023 Oct 16;18(1):127. doi: 10.1186/s11671-023-03903-8. Discov Nano. 2023. PMID: 37843732 Free PMC article. Review.
-
Application of DNA Aptamers and Quantum Dots to Lateral Flow Test Strips for Detection of Foodborne Pathogens with Improved Sensitivity versus Colloidal Gold.Pathogens. 2014 Apr 10;3(2):341-55. doi: 10.3390/pathogens3020341. Pathogens. 2014. PMID: 25437803 Free PMC article.
-
Selective Area Modification of Silicon Surface Wettability by Pulsed UV Laser Irradiation in Liquid Environment.J Vis Exp. 2015 Nov 9;(105):e52720. doi: 10.3791/52720. J Vis Exp. 2015. PMID: 26575362 Free PMC article.
-
In Vitro Intestinal Uptake And Permeability Of Fluorescently-Labelled Hyaluronic Acid Nanogels.Int J Nanomedicine. 2019 Nov 21;14:9077-9088. doi: 10.2147/IJN.S224255. eCollection 2019. Int J Nanomedicine. 2019. PMID: 31819420 Free PMC article.
References
-
- Ma, P., and R. Zemmel. 2002. The value of novelty? Nat. Rev. Drug Discov. 1:571–572. - PubMed
-
- O'Connor, T., and J. P. Gosling. 1997. The dependence of radioimmunoassay detection limits on antibody affinity. J. Immunol. Methods. 208:181–189. - PubMed
-
- Reed, R., D. Holmes, J. Weyers, and A. Jones. 1998. Practical Skills in Biomolecular Sciences. Addison Wesley Longman Limited, Essex, England.
-
- Weidemann, T., M. Wachsmuth, M. Tewes, K. Rippe, and J. Langowski. 2002. Analysis of ligand binding by two-colour fluorescence cross-correlation spectroscopy. Single Mol. 3:49–61.
-
- Reference deleted in proof.
Publication types
MeSH terms
Substances
LinkOut - more resources
Full Text Sources
Other Literature Sources
