

Profiling the thermodynamic softness of adenoviral promoters
- PMID: 18390611
- PMCID: PMC2440440
- DOI: 10.1529/biophysj.107.123471
Profiling the thermodynamic softness of adenoviral promoters
Abstract
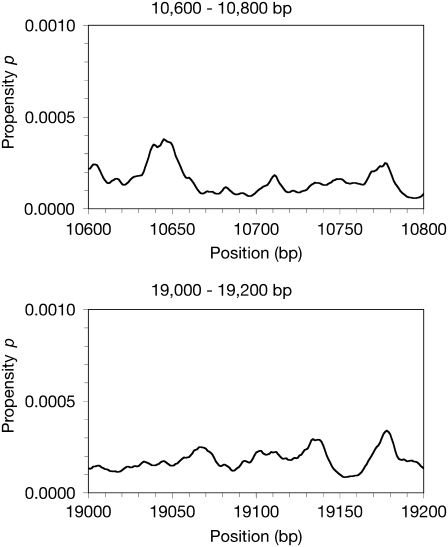
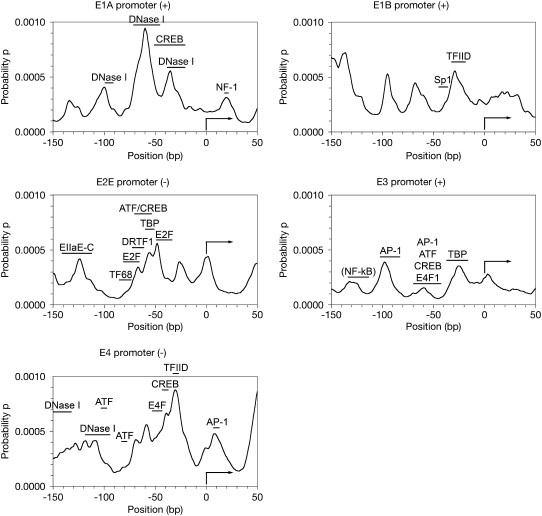
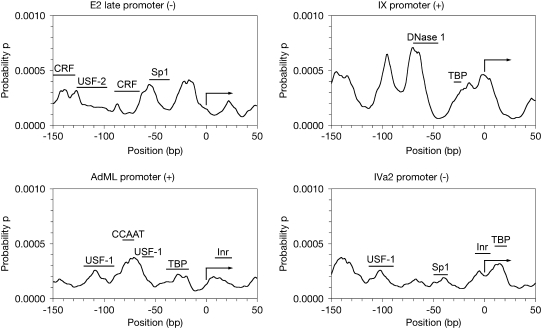
We showed previously that anharmonic DNA dynamical features correlate with transcriptional activity in selected viral promoters, and hypothesized that areas of DNA softness may represent loci of functional significance. The nine known promoters from human adenovirus type 5 were analyzed for inherent DNA softness using the Peyrard-Bishop-Dauxois model and a statistical mechanics approach, using a transfer integral operator. We found a loosely defined pattern of softness peaks distributed both upstream and downstream of the transcriptional start sites, and that early transcriptional regions tended to be softer than late promoter regions. When reported transcription factor binding sites were superimposed on our calculated softness profiles, we observed a close correspondence in many cases, which suggests that DNA duplex breathing dynamics may play a role in protein recognition of specific nucleotide sequences and protein-DNA binding. These results suggest that genetic information is stored not only in explicit codon sequences, but also may be encoded into local dynamic and structural features, and that it may be possible to access this obscured information using DNA dynamics calculations.
Figures
References
-
- International Human Genome Sequencing Consortium. 2004. Finishing the euchromatic sequence of the human genome. Nature. 431:931–945. - PubMed
-
- Werner, T. 2003. The state of the art of mammalian promoter recognition. Brief. Bioinform. 4:22–30. - PubMed
-
- Ohler, U., and H. Niemann. 2001. Identification and analysis of eukaryotic promoters: recent computational approaches. Trends Genet. 17:56–60. - PubMed
-
- Pedersen, A. G., P. Baldi, Y. Chauvin, and S. Brunak. 1999. The biology of eukaryotic promoter prediction–a review. Comput. Chem. 23:191–207. - PubMed
Publication types
MeSH terms
Substances
Grants and funding
LinkOut - more resources
Full Text Sources
