. 2008 Aug;95(3):1412-27.
doi: 10.1529/biophysj.108.130385. Epub 2008 Apr 4.

Ca2+-mobility in the sarcoplasmic reticulum of ventricular myocytes is low

Affiliations

Ca2+-mobility in the sarcoplasmic reticulum of ventricular myocytes is low

Pawel Swietach et al. Biophys J. 2008 Aug.

Abstract

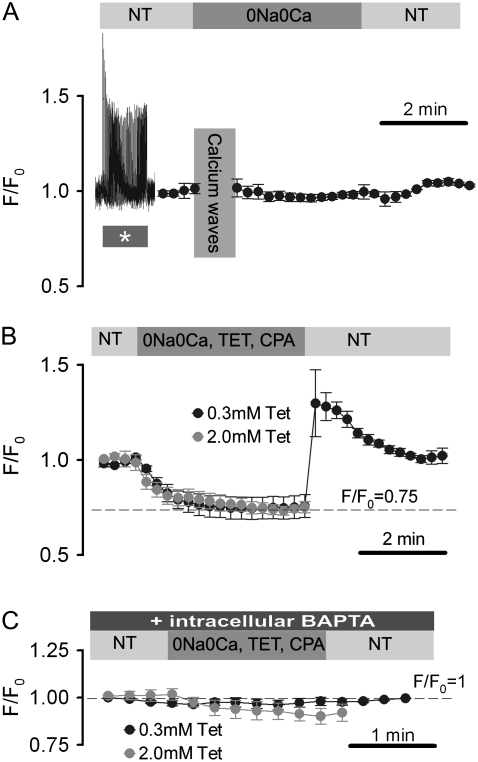
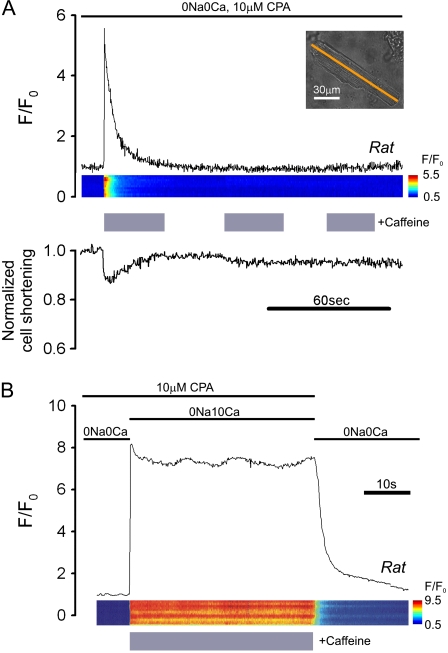
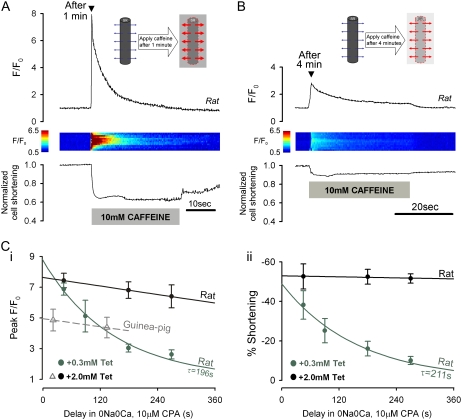
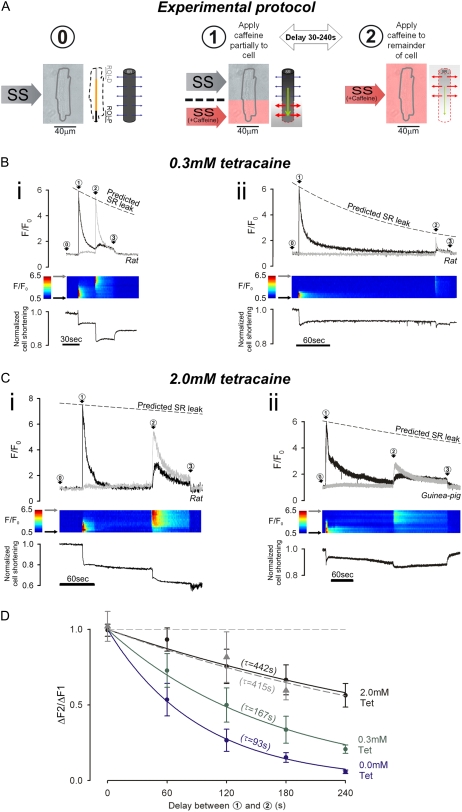
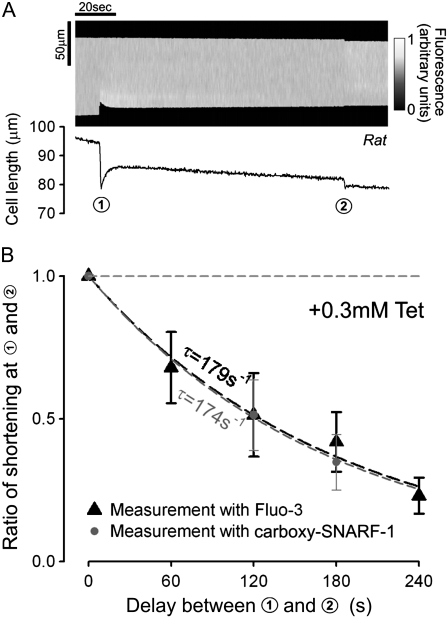
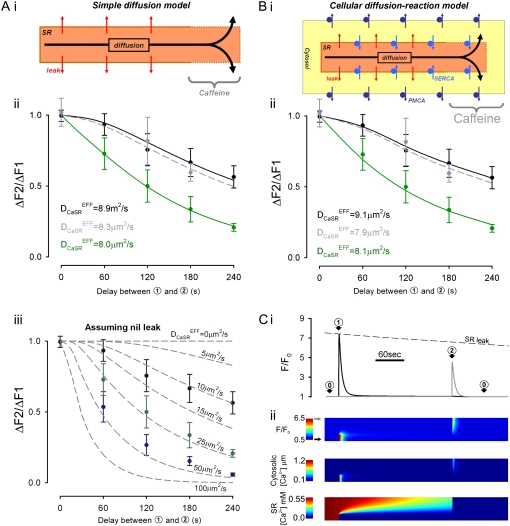
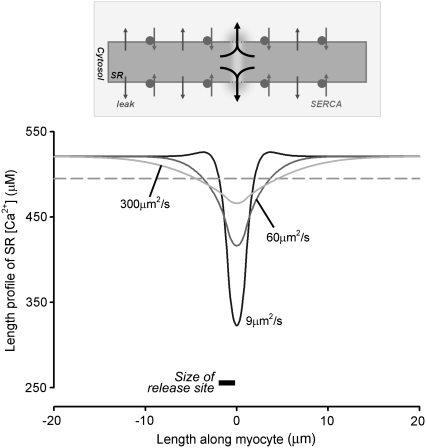
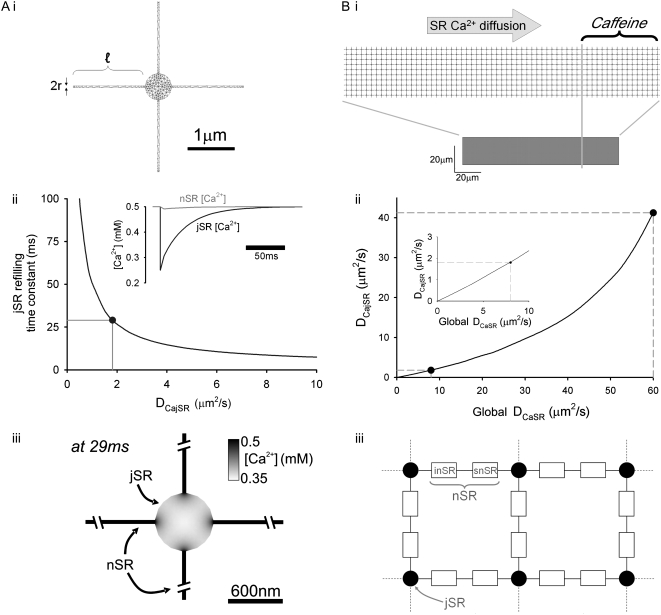
The sarcoplasmic reticulum (SR) in ventricular myocytes contains releasable Ca(2+) for activating cellular contraction. Recent measurements of intra-SR (luminal) Ca(2+) suggest a high diffusive Ca(2+)-mobility constant (D(CaSR)). This could help spatially to unify SR Ca(2+)-content ([Ca(2+)](SRT)) and standardize Ca(2+)-release throughout the cell. But measurements of localized depletions of luminal Ca(2+) (Ca(2+)-blinks), associated with local Ca(2+)-release (Ca(2+)-sparks), suggest D(CaSR) may actually be low. Here we describe a novel method for measuring D(CaSR). Using a cytoplasmic Ca(2+)-fluorophore, we estimate regional [Ca(2+)](SRT) from localized, caffeine-induced SR Ca(2+)-release. Caffeine microperfusion of one end of a guinea pig or rat myocyte diffusively empties the whole SR at a rate indicating D(CaSR) is 8-9 microm(2)/s, up to tenfold lower than previous estimates. Ignoring background SR Ca(2+)-leakage in our measurement protocol produces an artifactually high D(CaSR) (>40 microm(2)/s), which may also explain the previous high values. Diffusion-reaction modeling suggests that a low D(CaSR) would be sufficient to support local SR Ca(2+)-signaling within sarcomeres during excitation-contraction coupling. Low D(CaSR) also implies that [Ca(2+)](SRT) may readily become spatially nonuniform, particularly under pathological conditions of spatially nonuniform Ca(2+)-release. Local control of luminal Ca(2+), imposed by low D(CaSR), may complement the well-established local control of SR Ca(2+)-release by Ca(2+)-channel/ryanodine receptor couplons.


Figures

FIGURE 1
FIGURE 1
Protocol for stabilizing SR Ca2+ load. Rat myocytes. (A) Fluo-3 fluorescence (F/F0) was measured in cells paced at 2 Hz in NT, and then superfused with 0Na0Ca medium (fluorescence normalized to diastolic levels in NT). Ca2+-waves were observed in the first 2 min in 0Na0Ca. After waves ceased, diastolic F/F0 was ∼1. (B) In 0Na0Ca solution with SERCA inhibited by 10 μM CPA (stabilizing solution, SS), RyRs were dose-dependently inhibited by 0.3 or 2 mM Tet. Inclusion of Tet in SS-superfusate blocked Ca2+-waves. At both doses of Tet, resting F/F0 stabilized (at a 25% lower level) with a half-time of ∼36 s. Cells stabilized in SS + Tet were then used for the main experiments. (C) The reduction of resting F/F0 observed in the presence of SS + Tet was absent in rat cells preloaded with 100 μM BAPTA-AM. (AC) Mean of 7–10 cells.
FIGURE 2
FIGURE 2
Mobilizing SR Ca2+ with caffeine. (A) Rat myocyte, AM-loaded with Fluo-3 and initially paced at 2 Hz in NT was then superfused with 0Na0Ca medium containing 10 μM CPA (stabilizing solution, SS), interspersed with three 30-s episodes of SS + 10 mM caffeine. (Upper panel) time course for F/F0 averaged along a longitudinal line scan (inset indicates position of line scan axis); (middle panel) F/F0 line scan; (lower panel) cell shortening. The first caffeine exposure mobilizes all SR Ca2+. (B) Different rat myocyte exposed to SS containing 10 mM caffeine and 10 mM [Ca2+]o; note lack of formula image-recovery, suggesting block of sarcolemmal PMCA. Final recovery in 0Na0Ca (with zero CPA) is attributable to SERCA and PMCA activity.
FIGURE 3
FIGURE 3
Assessing SR Ca2+-leak. Myocytes paced at 2 Hz in NT were then superfused with SS containing 0.3 or 2.0 mM Tet. (A) After 1 min in SS + 0.3 mM Tet, rat myocyte was exposed to Tet-free SS + 10 mM caffeine for 30 s. (Upper panel) longitudinal line scan average for F/F0; (middle panel) F/F0 line scan (y axis normalized to cell length); (lower panel) cell shortening. (B) Different rat myocyte, exposed to caffeine after 4 min in SS + 0.3 mM Tet. Smaller Ca2+-release is due to longer preceding period of SR-membrane Ca2+-leakage. (C) (i) Peak F/F0 during caffeine-exposure, measured after 1–6 min delay (normalized to F/F0 at switch into SS) in rat myocytes in 0.3 mM (green) or 2 mM (black) Tet, and in guinea pig myocytes in 2 mM Tet (gray) (n = 5–10 cells/data-point). (ii) Cell shortening responses to caffeine in rat myocytes. Rundown of both F/F0 and cell shortening gives time course of SR depletion caused by Ca2+-leak.
FIGURE 4
FIGURE 4
Measuring SR Ca2+-mobility. Caffeine is used to estimate the decline of distal [Ca2+]SRT, while Ca2+ is being drained from the proximal end of SR. (A) Dual-microperfusion apparatus is used to deliver two solutions: SS (without Tet or with 0.3 or 2 mM Tet) and SS + caffeine (10 mM with no Tet). Myocyte is first bathed in SS + Tet (configuration 0). Throughout the experiment, intracellular Fluo-3 fluorescence (F/F0) is averaged in two ROIs, each 20% of cell length, one positioned proximally (ROI-P) and one distally (ROI-D), at the ends of a line scan (see schematic diagram shown to the right of configuration 0). SS + caffeine is then applied to proximal end of myocyte to start SR-drainage (configuration 1); after a 30–240 s delay, SS + caffeine is applied to whole cell (configuration 2) to assess remaining SR Ca2+-content. At the end of the experiment, cells are returned to 0Na0Ca, free of CPA, Tet, and caffeine (not illustrated, denoted by arrow 3 in B and C). (B) SS microstream (but not SS + caffeine microstream) contained 0.3 mM Tet. (i) Rat myocyte; delay of 30 s between configurations 1 and 2. (Upper panel) F/F0-time course for [Ca2+]i averaged in ROI-P (black trace) and ROI-D (gray trace). Dashed line shows predicted decline of caffeine-mobilizable Ca2+-release because of SR Ca2+-leak (from Fig. 3). (Middle panel) Longitudinal F/F0 line scan (y axis normalized to cell length). (Lower panel) cell shortening. (ii) Rat myocyte; delay of 240 s between configurations 1 and 2. (C) SS microstream (but not SS + caffeine microstream) contained 2.0 mM Tet. (i) Rat myocyte; delay of 120 s between configurations 1 and 2. (ii) Guinea pig myocyte; delay of 180 s between configurations 1 and 2. (D) Ratio of distal fluorescence rise (configuration 2) to initial proximal rise (configuration 1), ΔF2/ΔF1, for different delay times. Rat myocytes with 2 mM Tet (black), 0.3 mM Tet (green), and zero Tet (blue). Guinea pig myocytes with 2 mM Tet (gray) (4–12 cells/data point). Time constants (τ) obtained from monoexponential fits.
FIGURE 5
FIGURE 5
Distal SR depletion with proximal caffeine is unaffected by Fluo-3. (A) Myocyte AM-loaded with carboxy-SNARF-1, a non-Ca2+ binding fluorophore. Upper panel: fluorescence line scan (y axis shows cell length) used to monitor cell shortening (carboxy-SNARF-1 excitation at 514 nm, emission at 580 nm). (Lower panel) time course of cell shortening (derived from upper panel) in response to caffeine. Protocol of Fig. 4 was applied. Cell initially exposed to SS + 0.3 mM Tet. At circle 1, the proximal end of the cell exposed to SS + 10 mM caffeine; at circle 2 the whole cell exposed to SS + 10 mM caffeine. (B) Ratio of second/first shortening-event is plotted versus time delay between circles 1 and 2 in the presence of intracellular carboxy-SNARF-1 (black; n = 8, 7) or Fluo-3 (gray; n = 6–13). Time constants (τ) obtained from monoexponential fits. The presence of the Ca2+-binding fluorophore, Fluo-3, does not affect the rate of decline of distal contraction (and hence distal SR-depletion) during proximal caffeine exposure.
FIGURE 6
FIGURE 6
Quantifying DCaSR. (A) (i) Schematic diagram of the simple Ca2+-diffusion model, incorporating SR-membrane leak and proximal SR-exposure to caffeine (see Appendix 1). (ii) Best-fitting of diffusion model (SERCA activity = 0, simulating CPA-addition) to data in Fig. 4 D gives displayed values for DCaSR (0.3 mM Tet, green; 2 mM Tet, black: rat myocytes; 2 mM Tet, gray: guinea pig myocytes). Note unique value for DCaSR (8–9 μm2/s). (iii) Best-fitting when SR Ca2+-leak is ignored; note lack of unique value for DCaSR (42, 23, and 10 μm2/s for rat myocyte data (Fig. 4 D) with 0, 0.3, and 2 mM Tet, respectively). (B) (i) Schematic diagram of diffusion-reaction model showing principal reaction elements (see Appendix 1). (ii) Displayed DCaSR: best-fit values averaged between 0 and 240 s. (Green) rat, 0.3 mM Tet; (black) rat, 2 mM Tet; (gray) guinea pig, 2 mM Tet. Note similarity with DCaSR values from Aii. (C) Output of cellular diffusion-reaction model simulating experimental protocol (Fig. 4). (i) Time course of F/F0 from simulated line scan in proximal (black) and distal (gray) ROIs. (ii) Simulated line scans for F/F0, [Ca2+]i and [Ca2+]SR.
FIGURE 7
FIGURE 7
Effect of DCaSR on longitudinal [Ca2+]SR profile during simulated local Ca2+-release. Diffusion-reaction model was run to simulate local SR Ca2+-release (see Appendix 1). [Ca2+]SR was calculated 250 ms after increasing SR-membrane permeability to 1.35 μM/s in a central 2 μm length of SR. This estimate of DCaSR (9 μm2/s) supports large and localized SR-depletion, with only small effects on adjacent luminal regions. Higher DCaSR significantly depletes SR Ca2+ from regions beyond the release site. (Dashed line) 5% depletion threshold.
FIGURE 8
FIGURE 8
Modeling Ca2+-diffusion in SR nanoarchitecture. (A) (i) 2-D geometry for a unit of sarcomeric SR (jSR-cisterna connected to four nSR-tubes) triangulated for diffusion modeling. (ii) To simulate jSR Ca2+-recovery after local Ca2+-release, [Ca2+]jSR was set instantaneously to 0.25 (50% depletion), whereas [Ca2+]nSR was set initially to 0.5 mM and the distal ends of the nSR elements were coupled to an infinite 0.5 mM Ca2+ source. The time constant (τ) of recovery of [Ca2+]jSR was then derived for a range of jSR Ca2+-mobility values (DCajSR), with Ca2+-mobility in nSR assumed to be 1000 μm2/s. The predicted time courses of change for [Ca2+]jSR and [Ca2+]nSR are shown in the inset. Filled circle denotes τ = 29 ms, which has been determined experimentally for rabbit SR Ca2+-blinks. (iii) Spatial [Ca2+]SR map after 29 ms of jSR-refilling for a DCajSR of 1.8 μm2/s. (B) (i) 63 × 10 SR units based on Ai, coupled into a 2-D network for simulating whole-SR during proximal caffeine exposure (see Appendix 2). (ii) Predicted relationship between global DCaSR and DCajSR. DCajSR of 1.8 μm2/s (derived from normal Ca2+-blink recovery rate) predicts a global DCaSR of 8 μm2/s, similar to the value measured experimentally. In contrast, a high global DCaSR (60 μm2/s) predicts a relatively high DCajSR (41 μm2/s), which would then predict an ultrafast Ca2+-blink recovery τ of <1 ms (see Aii). (Inset) Close-up of DCaSR range between 0 and 10 μm2/s. (iii) Model of nSR/jSR unit featuring a minimal length nSR (0.65 μm), divided into snSR and inSR. Diffusion in the inSR is slower than in the snSR (see Appendix 2 for details).

Similar articles

Cited by

References

    1. Page, E. 1978. Quantitative ultrastructural analysis in cardiac membrane physiology. Am. J. Physiol. 235:C147–C158. - PubMed
    1. Brochet, D. X., D. Yang, A. Di Maio, W. J. Lederer, C. Franzini-Armstrong, and H. Cheng. 2005. Ca2+ blinks: rapid nanoscopic store calcium signaling. Proc. Natl. Acad. Sci. USA. 102:3099–3104. - PMC - PubMed
    1. Shannon, T. R., K. S. Ginsburg, and D. M. Bers. 2000. Reverse mode of the sarcoplasmic reticulum calcium pump and load-dependent cytosolic calcium decline in voltage-clamped cardiac ventricular myocytes. Biophys. J. 78:322–333. - PMC - PubMed
    1. Bers, D. M. 2002. Sarcoplasmic reticulum Ca2+ release in intact ventricular myocytes. Front. Biosci. 7:1697–1711. - PubMed
    1. Stern, M. D. 1992. Theory of excitation-contraction coupling in cardiac muscle. Biophys. J. 63:497–517. - PMC - PubMed

Publication types