

Measuring diffusion and binding kinetics by contact area FRAP
- PMID: 18390627
- PMCID: PMC2440437
- DOI: 10.1529/biophysj.107.114447
Measuring diffusion and binding kinetics by contact area FRAP
Abstract
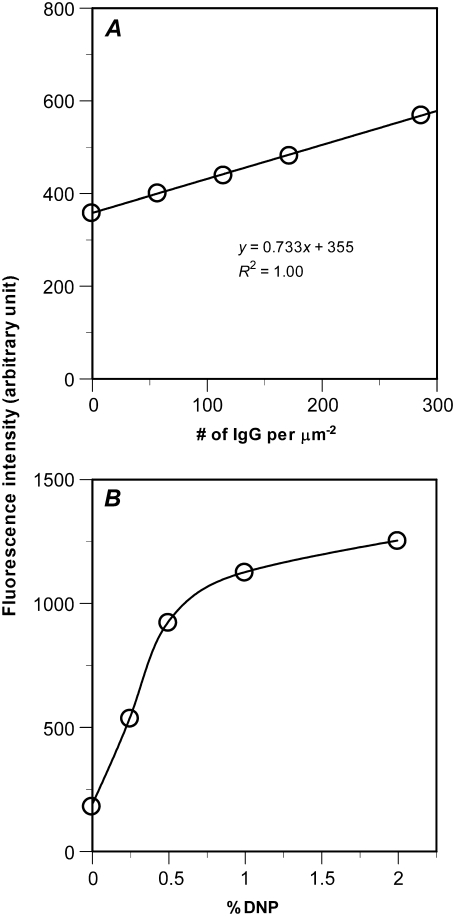
The immunological synapse is a stable intercellular structure that specializes in substance and signal transfer from one immune cell to another. Its formation is regulated in part by the diffusion of adhesion and signaling molecules into, and their binding of countermolecules in the contact area. The stability of immunological synapses allows receptor-ligand interactions to approximate chemical equilibrium despite other dynamic aspects. We have developed a mathematical model that describes the coupled reaction-diffusion process in an established immunological synapse. In this study, we extend a previously described contact area fluorescence recovery after photobleaching (FRAP) experiment to test the validity of the model. The receptor binding activity and lateral mobility of fluorescently labeled, lipid-anchored ligands in the bilayer resulted in their accumulation, as revealed by a much higher fluorescence intensity inside the contact area than outside. After complete photobleaching of the synapse, fluorescence recovery requires ligands to dissociate and rebind, and to diffuse in and out of the contact area. Such a FRAP time course consequently provides information on reaction and diffusion, which can be extracted by fitting the model solution to the data. Surprisingly, reverse rates in the two-dimensional contact area were at least 100-fold slower than in three-dimensional solution. As previously reported in immunological synapses, a significant nonrecoverable fraction of fluorescence was observed with one of two systems studied, suggesting some ligands either dissociated or diffused much more slowly compared with other ligands in the same synapse. The combined theory and experiment thus provides a new method for in situ measurements of kinetic rates, diffusion coefficients, and nonrecoverable fractions of interacting molecules in immunological synapses and other stable cell-bilayer junctions.
Figures


Similar articles
-
A coupled diffusion-kinetics model for analysis of contact-area FRAP experiment.Biophys J. 2008 Jul;95(2):910-9. doi: 10.1529/biophysj.107.114439. Epub 2008 Apr 4. Biophys J. 2008. PMID: 18390628 Free PMC article.
-
A closed-form analytic expression for FRAP formula for the binding diffusion model.Biophys J. 2008 Jul;95(2):L13-5. doi: 10.1529/biophysj.108.135913. Epub 2008 May 16. Biophys J. 2008. PMID: 18487305 Free PMC article.
-
Fluorescence recovery after photobleaching: the case of anomalous diffusion.Biophys J. 2008 Jun;94(12):4646-53. doi: 10.1529/biophysj.107.119081. Epub 2008 Mar 7. Biophys J. 2008. PMID: 18326658 Free PMC article.
-
FRAP analysis of binding: proper and fitting.Trends Cell Biol. 2005 Feb;15(2):84-91. doi: 10.1016/j.tcb.2004.12.001. Trends Cell Biol. 2005. PMID: 15695095 Review.
-
Recent applications of fluorescence recovery after photobleaching (FRAP) to membrane bio-macromolecules.Sensors (Basel). 2010;10(6):5927-48. doi: 10.3390/s100605927. Epub 2010 Jun 10. Sensors (Basel). 2010. PMID: 22219695 Free PMC article. Review.
Cited by
-
Quantitative Bio-Imaging Tools to Dissect the Interplay of Membrane and Cytoskeletal Actin Dynamics in Immune Cells.Front Immunol. 2021 Jan 11;11:612542. doi: 10.3389/fimmu.2020.612542. eCollection 2020. Front Immunol. 2021. PMID: 33505401 Free PMC article. Review.
-
Going deeper than microscopy: the optical imaging frontier in biology.Nat Methods. 2010 Aug;7(8):603-14. doi: 10.1038/nmeth.1483. Epub 2010 Jul 30. Nat Methods. 2010. PMID: 20676081 Review.
-
Acoustic sensors as a biophysical tool for probing cell attachment and cell/surface interactions.Cell Mol Life Sci. 2012 Feb;69(3):357-71. doi: 10.1007/s00018-011-0854-8. Epub 2011 Oct 15. Cell Mol Life Sci. 2012. PMID: 21997385 Free PMC article. Review.
-
Functional anatomy of T cell activation and synapse formation.Annu Rev Immunol. 2010;28:79-105. doi: 10.1146/annurev-immunol-030409-101308. Annu Rev Immunol. 2010. PMID: 19968559 Free PMC article. Review.
-
Insights from in situ analysis of TCR-pMHC recognition: response of an interaction network.Immunol Rev. 2013 Jan;251(1):49-64. doi: 10.1111/imr.12016. Immunol Rev. 2013. PMID: 23278740 Free PMC article. Review.
References
-
- Dustin, M. L., and D. R. Colman. 2002. Neural and immunological synaptic relations. Science. 298:785–789. - PubMed
-
- Vasioukhin, V., C. Bauer, M. Yin, and E. Fuchs. 2000. Directed actin polymerization is the driving force for epithelial cell-cell adhesion. Cell. 100:209–219. - PubMed
-
- Dustin, M. L., M. W. Olszowy, A. D. Holdorf, J. Li, S. Bromley, N. Desai, P. Widder, F. Rosenberger, P. A. van der Merwe, P. M. Allen, and A. S. Shaw. 1998. A novel adaptor protein orchestrates receptor patterning and cytoskeletal polarity in T-cell contacts. Cell. 94:667–677. - PubMed
Publication types
MeSH terms
Substances
Grants and funding
LinkOut - more resources
Full Text Sources
Other Literature Sources
Research Materials
Miscellaneous
