. 2008 Jun 6;283(23):16124-34.
doi: 10.1074/jbc.M707104200. Epub 2008 Apr 7.

Inhibition of recombinant human T-type calcium channels by Delta9-tetrahydrocannabinol and cannabidiol

Affiliations

Inhibition of recombinant human T-type calcium channels by Delta9-tetrahydrocannabinol and cannabidiol

Hamish Redmond Ross et al. J Biol Chem. .

Abstract

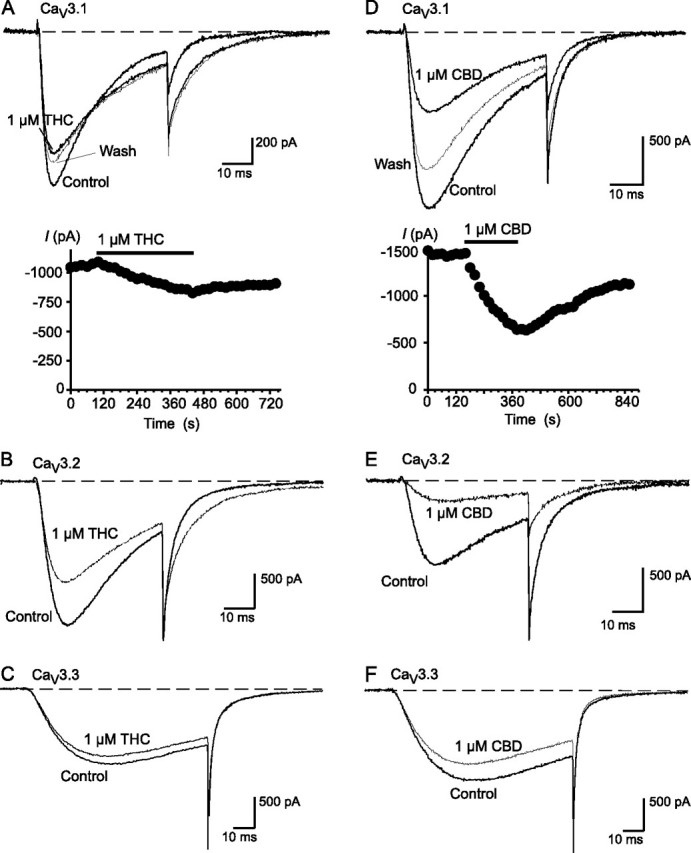
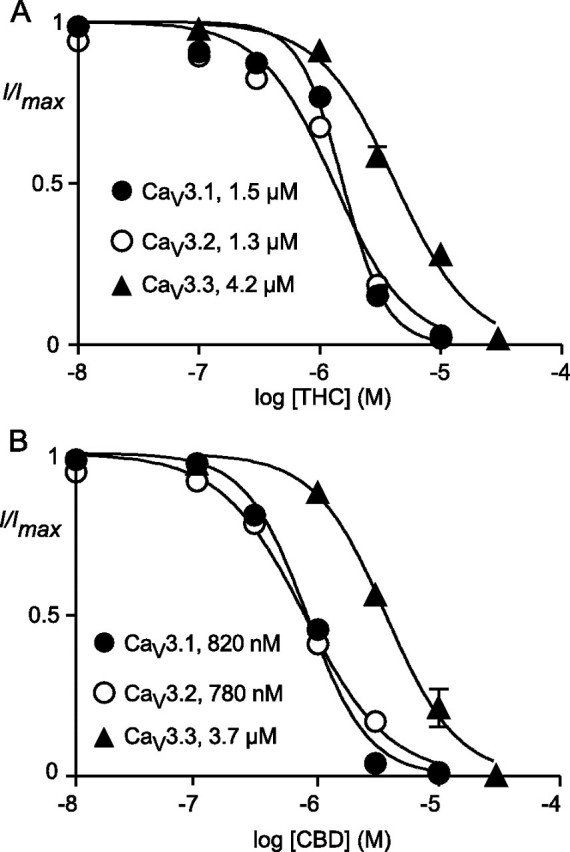
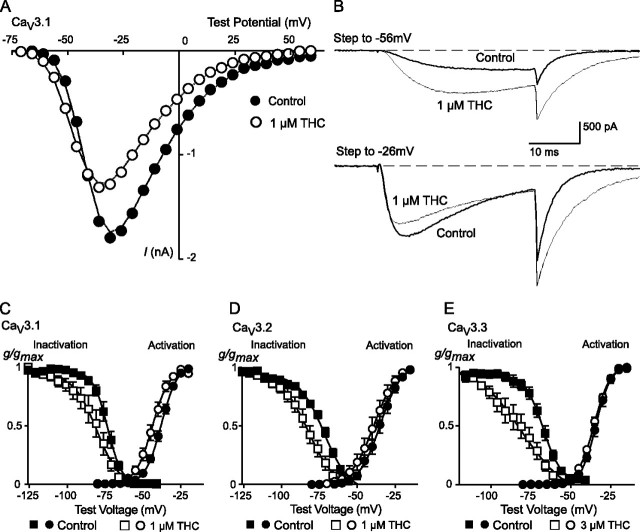
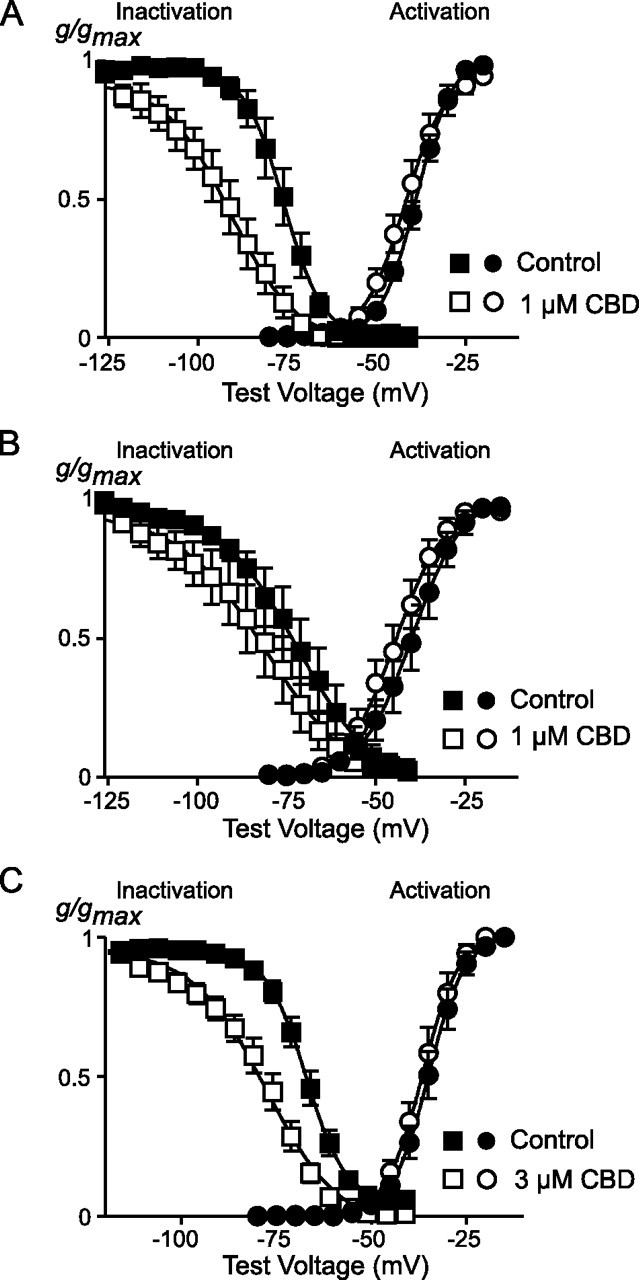
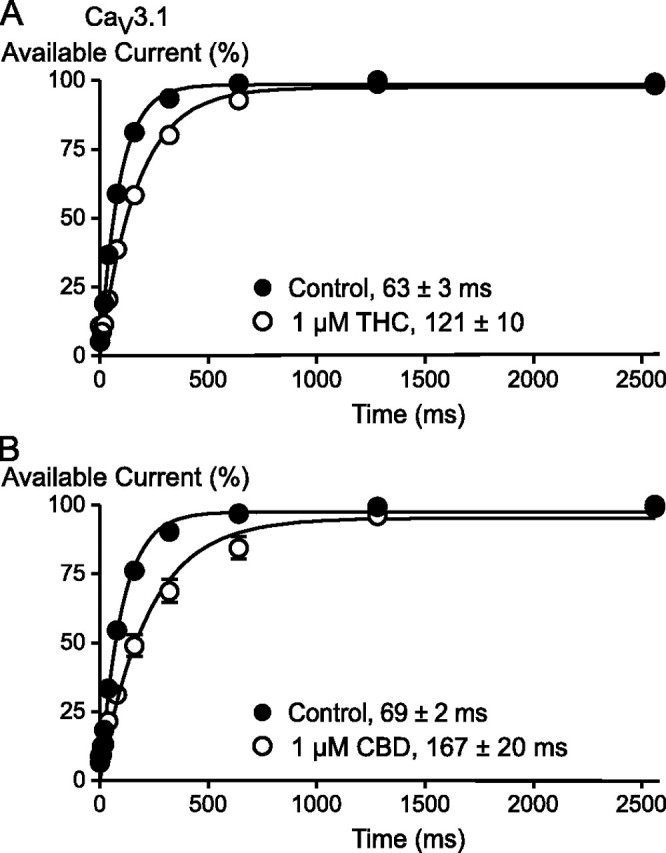
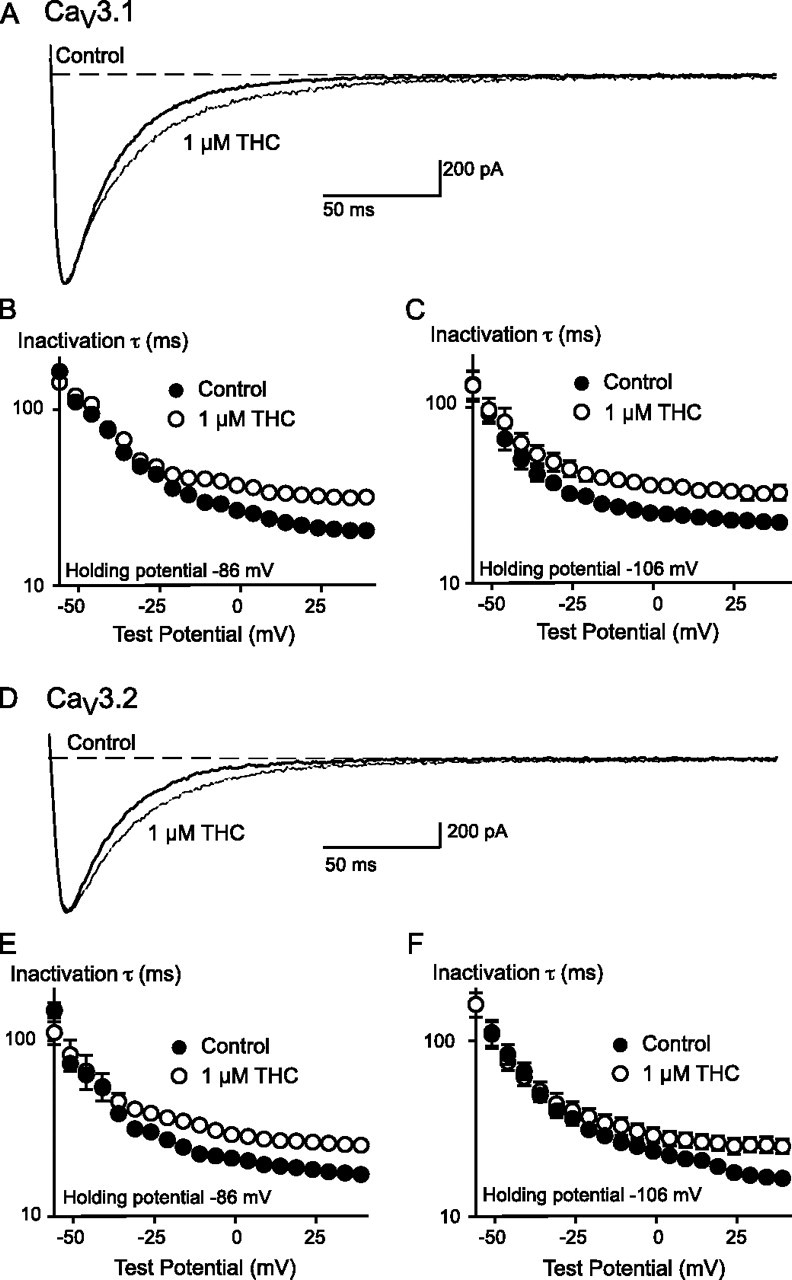
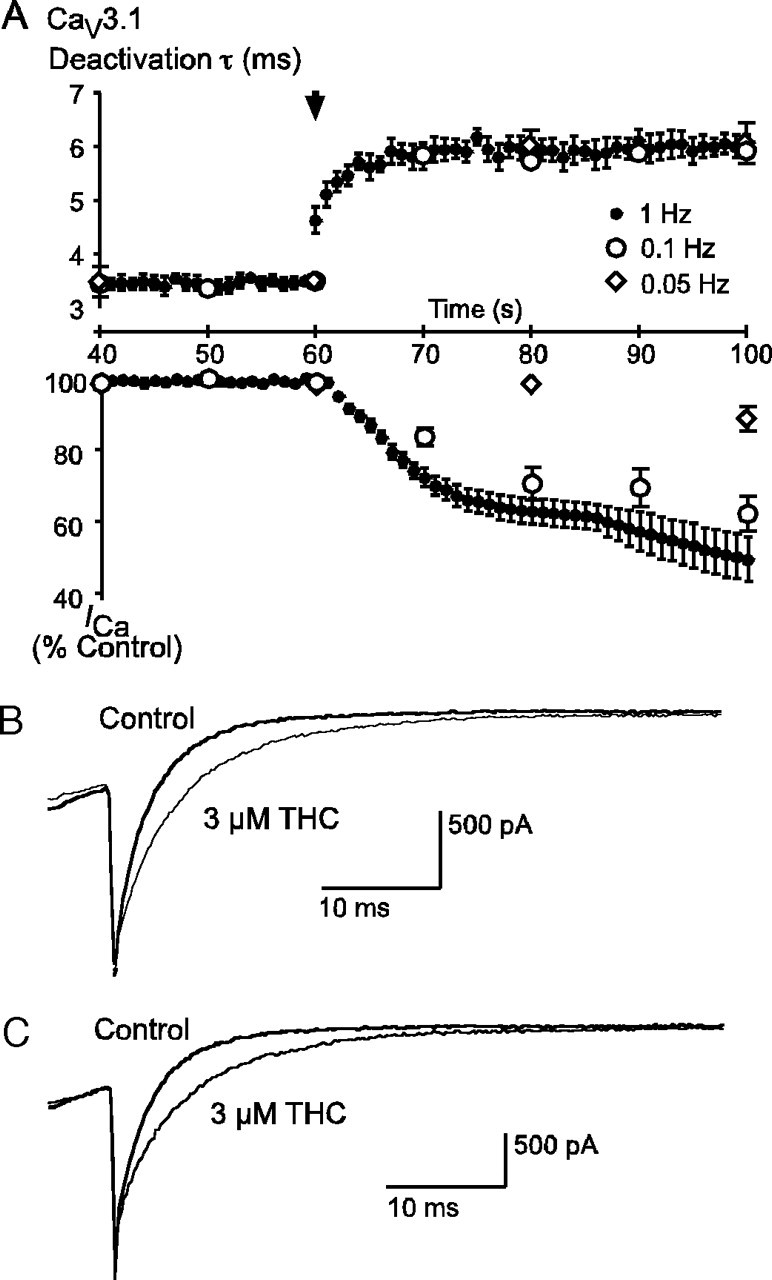
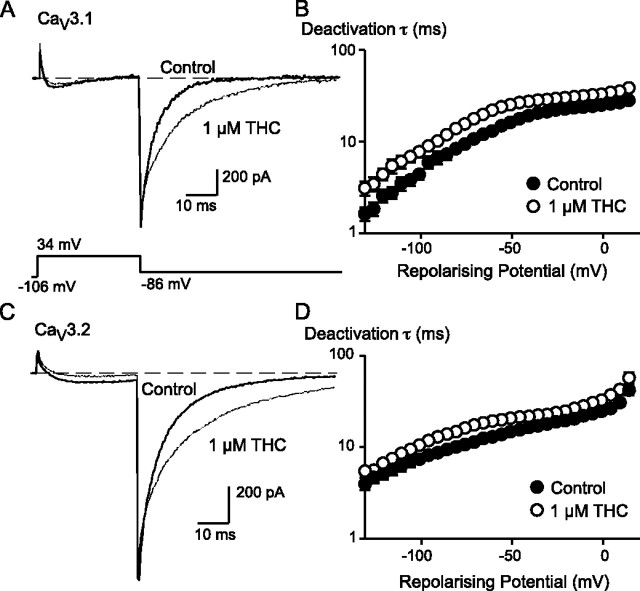
Delta(9)-Tetrahydrocannabinol (THC) and cannabidiol (CBD) are the most prevalent biologically active constituents of Cannabis sativa. THC is the prototypic cannabinoid CB1 receptor agonist and is psychoactive and analgesic. CBD is also analgesic, but it is not a CB1 receptor agonist. Low voltage-activated T-type calcium channels, encoded by the Ca(V)3 gene family, regulate the excitability of many cells, including neurons involved in nociceptive processing. We examined the effects of THC and CBD on human Ca(V)3 channels stably expressed in human embryonic kidney 293 cells and T-type channels in mouse sensory neurons using whole-cell, patch clamp recordings. At moderately hyperpolarized potentials, THC and CBD inhibited peak Ca(V)3.1 and Ca(V)3.2 currents with IC(50) values of approximately 1 mum but were less potent on Ca(V)3.3 channels. THC and CBD inhibited sensory neuron T-type channels by about 45% at 1 mum. However, in recordings made from a holding potential of -70 mV, 100 nm THC or CBD inhibited more than 50% of the peak Ca(V)3.1 current. THC and CBD produced a significant hyperpolarizing shift in the steady state inactivation potentials for each of the Ca(V)3 channels, which accounts for inhibition of channel currents. Additionally, THC caused a modest hyperpolarizing shift in the activation of Ca(V)3.1 and Ca(V)3.2. THC but not CBD slowed Ca(V)3.1 and Ca(V)3.2 deactivation and inactivation kinetics. Thus, THC and CBD inhibit Ca(V)3 channels at pharmacologically relevant concentrations. However, THC, but not CBD, may also increase the amount of calcium entry following T-type channel activation by stabilizing open states of the channel.


Figures

FIGURE 1.
FIGURE 1.
THC and CBD inhibit CaV3 calcium channels. Recordings of recombinant human CaV3 channels stably expressed in HEK293 cells were made as outlined under “Experimental Procedures.” Each trace represents the current elicited by a voltage step from -86 mV to -26 mV under control conditions and in the presence of 1 μm THC (A, CaV3.1; B, CaV3.2; C, CaV3.3) or CBD (D, CaV3.1; E, CaV3.2; F, CaV3.3). An example of the time course of inhibition and degree of reversibility for THC and CBD inhibition of CaV3.1 are illustrated in A and D, respectively. The data are representative of at least six cells for each experiment.
FIGURE 2.
FIGURE 2.
Concentration-response curve for the effect of THC (A) and CBD (B) on CaV3.1, CaV3.2, and CaV3.3 channels. Each point represents the mean ± S.E. of 6 cells and is presented as current remaining in the presence of drug compared with predrug current (I/Imax). One concentration of drug was applied per cell. The EC50 values reported are derived from the pEC50 values reported in Table 1.
FIGURE 3.
FIGURE 3.
The onset of THC inhibition of CaV3.1 is use-dependent, and that of CBD is not. A, cells expressing CaV3.1 currents were stepped repetitively at 1, 0.1, and 0.05 Hz. 3 μm THC was superfused from the point indicated by the arrowhead. Each point represents the mean ± S.E. of 6 cells. The time to reach maximal inhibition is indicated on the figure; the times were significantly different at each frequency (one-way ANOVA, p < 0.05). B, cells expressing CaV3.1 currents were stepped repetitively at 1 and 0.05 Hz. 3 μm CBD was superfused from the point indicated by the arrowhead. Each point represents the mean ± S.E. of 6 cells; there was no difference in the time taken for CBD inhibition to reach equilibrium.
FIGURE 4.
FIGURE 4.
THC and CBD inhibition of CaV3.1 is enhanced at less negative holding potentials. Cells expressing CaV3.1 were held at -70mV, a potential at which most channels would be inactivated, and currents were elicited by a step to -26 mV every 1 s. THC (100 nm (A)) and CBD (100 nm (B)) both inhibited CaV3.1 by more than 50% under these conditions. The left-hand panels illustrate the time courses of inhibition, with the data from 6 cells pooled for each drug. The right-hand panels show representative traces for THC and CBD inhibition of the small currents elicited from -70 mV.
FIGURE 5.
FIGURE 5.
THC and CBD inhibit native T-type calcium channels in acutely isolated mouse trigeminal ganglion neurons. Cells were voltage-clamped at -80 mV and T-type current elicited by a step to -40 mV in order to minimize activation of native high voltage-activated channels.A, THC inhibition persisted in the presence of the CB1 antagonist AM251, which itself modestly inhibited the T-type currents. The inhibition by THC was not associated with a change in the kinetics of channel inactivation or deactivation, implying that these cells express predominantly CaV3.3. B, CBD also inhibited native T-type ICa in mouse trigeminal ganglion neurons. The time plots and traces are representative of at least 6 cells for each experiment.
FIGURE 6.
FIGURE 6.
THC affects the activation and inactivation of CaV3 channels. A, current-voltage (I-V) relationship showing the activation of CaV3.1 from a holding potential of -106 mV in the absence and presence of 1 μm THC. The peak inward current amplitude is plotted. B, example traces from this experiment illustrating the effect of 1 μm THC at test potentials of -56 and -26 mV; current is enhanced at lower test potentials and inhibited at more depolarized potentials. The effects of THC on activation and steady state inactivation of CaV3 currents are illustrated: C, CaV3.1; D, CaV3.2; E, CaV3.3. Cells were voltage-clamped at -106 mV. For steady state inactivation, cells were voltage-clamped at the test potential for 2 s before currents were evoked by a step to -26 mV. For steady state inactivation, data are presented as conductance normalized to conductance at -26 mV; for activation curves data are normalized to the maximum conductance. The data are fitted with a Boltzmann equation; the effects of THC on activation and inactivation parameters are reported in Table 2. Each data point represents the mean ± S.E. of 6 cells.
FIGURE 7.
FIGURE 7.
CBD affects the inactivation but not activation of CaV3 channels. The effects of CBD on activation and steady state inactivation of CaV3 currents are illustrated: i, CaV3.1; B, CaV3.2; C, CaV3.3. Cells were voltage-clamped at -106 mV. For steady state inactivation, cells were voltage-clamped at the test potential for 2 s before currents were evoked by a step to -26 mV. For steady state inactivation, data are presented as conductance normalized to conductance at -26 mV; for activation curves data are normalized to the maximum conductance. The data are fitted with a Boltzmann equation; the effects of CBD on activation and inactivation parameters are reported in Table 2. Each data point represents the mean ± S.E. of 6 cells.
FIGURE 8.
FIGURE 8.
THC and CBD slow the recovery of CaV3.1 channels from inactivation. This effect is illustrated for THC (A) and CBD (B). Cells were voltage-clamped at -86 mV, stepped to -26 mV for 70 ms, and then retested with 10-ms steps to -26 mV at 10, 20, 40, 80, 160, 320, 640, 1280, and 2560 ms later. Each point represents the mean ± S.E. of 6 cells. Data were fitted with a single exponential function, and the half-time for recovery is shown. The half-time was significantly slowed (p < 0.01) by both CBD and THC.
FIGURE 9.
FIGURE 9.
THC slows the inactivation from an open state of both CaV3.1 and CaV3.2. The effect of 1 μm THC on CaV3.1 inactivation is illustrated in A. the cell was voltage-clamped at -106 mV and stepped to 4 mV. The amplitude of the trace in the presence of THC was normalized to the control trace to allow ready comparison of the inactivation kinetics. The time constants of inactivation for CaV3.1 channels at holding potentials of -86 mV (B) and -106 mV (C) are also illustrated. The effect of 1 μm THC on CaV3.2 inactivation is illustrated in B. The cell was voltage-clamped at -106 mV and stepped to 4 mV. The amplitude of the trace in the presence of THC was normalized to the control trace to allow a ready comparison of the inactivation kinetics. The time constants of inactivation for CaV3.2 channels at holding potentials of -86 mV (C) and -106 mV (D) are also illustrated. Each point represents the mean ± S.E. of 6 cells. In the presence of THC the time constants for inactivation were significantly different from control for both channels at either holding potential (ANOVA, p < 0.05).
FIGURE 10.
FIGURE 10.
THC slows the deactivation of CaV3.1. A, the time course of 3 μm THC slowing of channel deactivation is compared with the THC inhibition of the peak current. Cells were stepped repetitively from -86 to -26 mV at 1, 0.1, and 0.05 Hz. The beginning of THC perfusion is indicated by the arrow-head. The time constant for channel deactivation following repolarization is compared with peak current amplitude, and the onset of the effect on channel deactivation is uncoupled from inhibition of the peak current and happens much more quickly. Each point represents the mean ± S.E. of 6 cells. Example traces illustrate the identical effect of 3 μm THC on tail currents at 5 s after application during 1-Hz stimulation (B) and 20 s after application during 0.05-Hz stimulation (C).
FIGURE 11.
FIGURE 11.
THC slows deactivation of CaV3 channels at all test potentials. The effect of 1 μm THC on CaV3.1 deactivation is illustrated in A. The cell was voltage-clamped at -106 mV and stepped to +34 mV. The trace in the presence of THC was normalized to amplitude of the tail current of the control trace to allow ready comparison of the inactivation kinetics. B, the constant of deactivation of CaV3.1 channels at various potentials from a holding potential of -106 mV. The effect of 1 μm THC on CaV3.2 deactivation is illustrated in C. The cell was voltage-clamped at -106 mV and stepped to +34 mV. The trace in the presence of THC was normalized to the amplitude of the tail current of the control trace to allow ready comparison of the inactivation kinetics. D, the constant of deactivation of CaV3.2 channels at various potentials from a holding potential of -106 mV. Each point represents the mean ± S.E. of 6 cells. In the presence of THC, the time constants for deactivation were significantly different from the control for both channels (ANOVA, p < 0.05).

Similar articles

Cited by

References

    1. xLemberger, L. (1980) Annu. Rev. Pharmacol. Toxicol. 20 151-172 - PubMed
    1. Teesson, M., Baillie, A., Lynskey, M., Manor, B., and Degenhardt, L. (2006) Drug Alcohol Depend. 81 149-155 - PubMed
    1. Gorter, R. W., Butorac, M., Cobian, E. P., and van der Sluis, W. (2005) Neurology 64 917-919 - PubMed
    1. Ware, M. A., Doyle, C. R., Woods, R., Lynch, M. E., and Clark, A. J. (2003) Pain 102 211-216 - PubMed
    1. Gross, D. W., Hamm, J., Ashworth, N. L., and Quigley, D. (2004) Neurology 62 2095-2097 - PubMed

Publication types

MeSH terms