. 2008 Jun;28(12):3967-78.
doi: 10.1128/MCB.01942-07. Epub 2008 Apr 7.

Targeted disruption of the basic Krüppel-like factor gene (Klf3) reveals a role in adipogenesis

Affiliations

Targeted disruption of the basic Krüppel-like factor gene (Klf3) reveals a role in adipogenesis

Nancy Sue et al. Mol Cell Biol. 2008 Jun.

Abstract

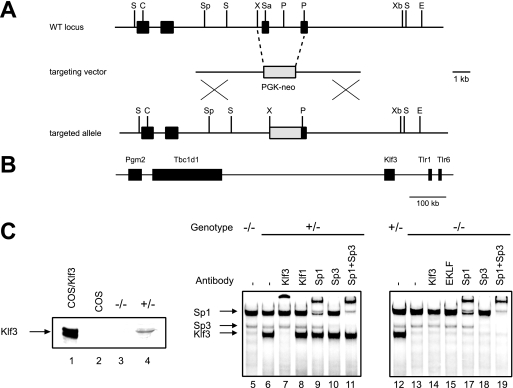
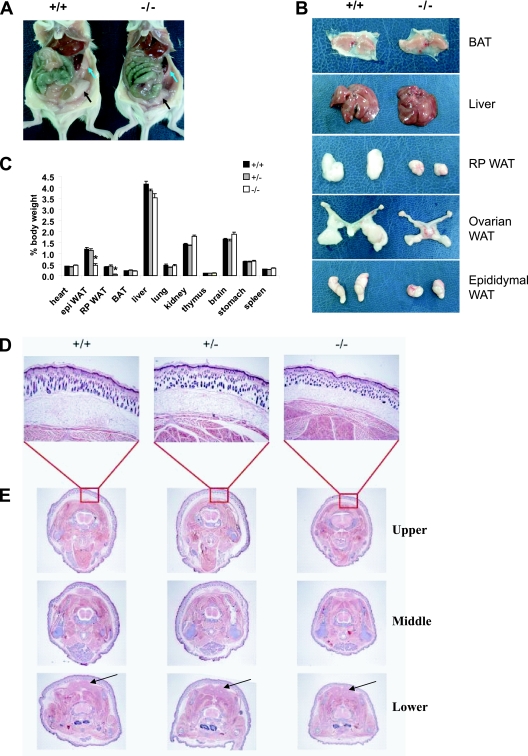
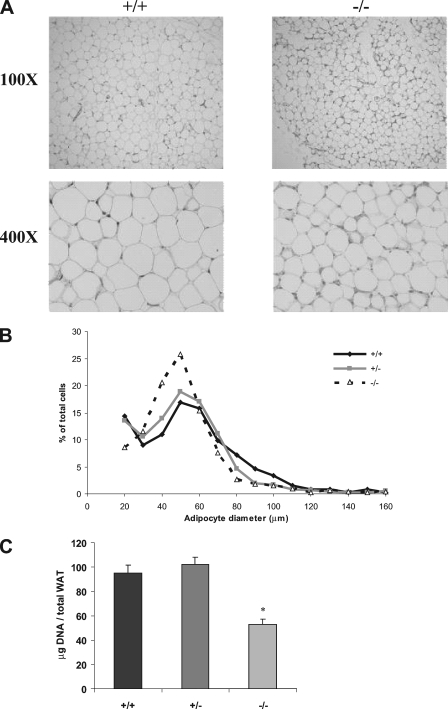
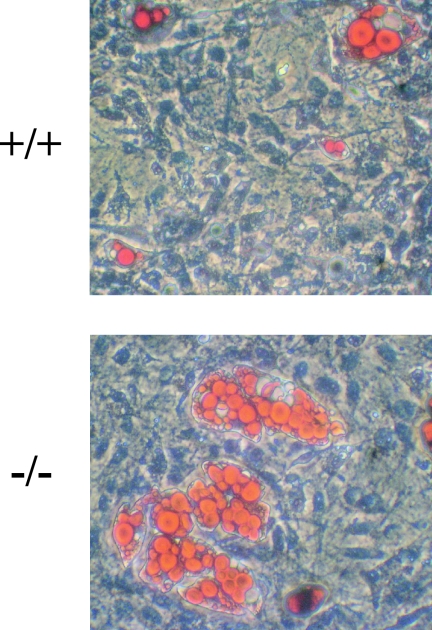
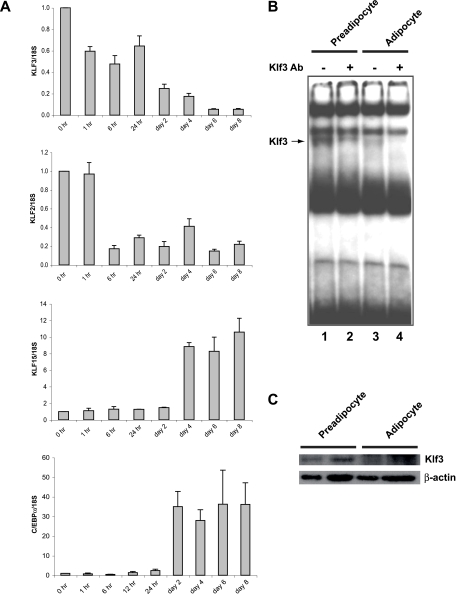
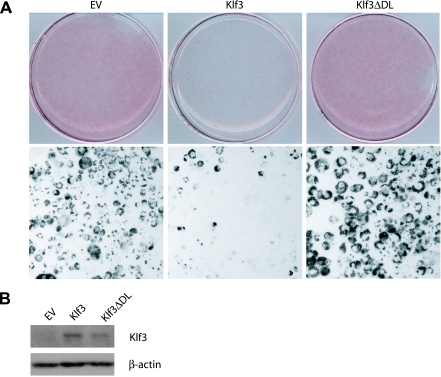
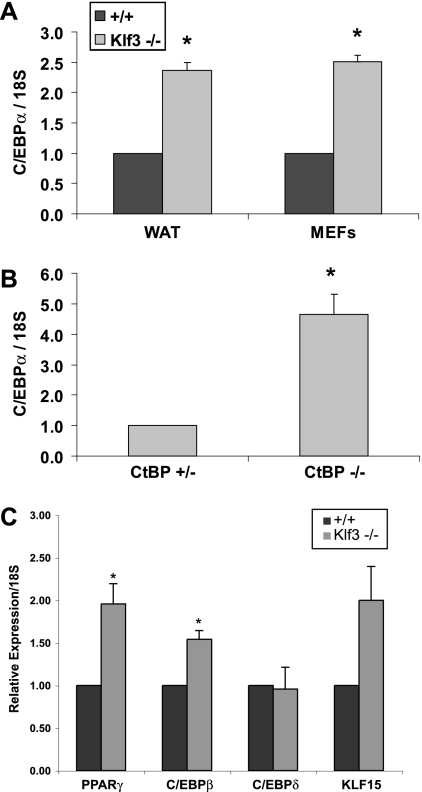
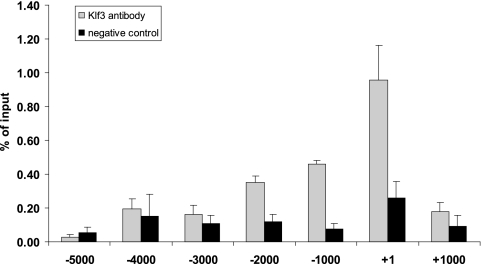
Krüppel-like factors (KLFs) recognize CACCC and GC-rich sequences in gene regulatory elements. Here, we describe the disruption of the murine basic Krüppel-like factor gene (Bklf or Klf3). Klf3 knockout mice have less white adipose tissue, and their fat pads contain smaller and fewer cells. Adipocyte differentiation is altered in murine embryonic fibroblasts from Klf3 knockouts. Klf3 expression was studied in the 3T3-L1 cellular system. Adipocyte differentiation is accompanied by a decline in Klf3 expression, and forced overexpression of Klf3 blocks 3T3-L1 differentiation. Klf3 represses transcription by recruiting C-terminal binding protein (CtBP) corepressors. CtBPs bind NADH and may function as metabolic sensors. A Klf3 mutant that does not bind CtBP cannot block adipogenesis. Other KLFs, Klf2, Klf5, and Klf15, also regulate adipogenesis, and functional CACCC elements occur in key adipogenic genes, including in the C/ebpalpha promoter. We find that C/ebpalpha is derepressed in Klf3 and Ctbp knockout fibroblasts and adipocytes from Klf3 knockout mice. Chromatin immunoprecipitations confirm that Klf3 binds the C/ebpalpha promoter in vivo. These results implicate Klf3 and CtBP in controlling adipogenesis.


Figures

FIG. 1.
FIG. 1.
Targeted disruption of Klf3 in mice. (A) Generation of Klf3 knockout mice. Schematic representation of the wild-type (WT) Klf3 locus (with a partial restriction map), the targeting vector, and the targeted allele. Black boxes represent exons. The zinc finger domain is contained in the last two exons. The gray box represents the phosphoglycerate kinase (PGK)-neo cassette. Abbreviations: S, StuI; C, ClaI; Sp, SpeI; X, XhoI; Sa, SalI; P, PmlI; Xb, XbaI. (B) Schematic showing genomic location of murine Klf3 and neighboring genes on chromosome 5. Pgm2, glucose phosphomutase 2; Tbc1d1, TBC1 domain family, member 1; Tlr1, Toll-like receptor 1; and Tlr6, Toll-like receptor 6. (C) Western blotting (left panel) using anti-Klf3 serum, showing full-length Klf3 ectopically expressed in COS cells (lane 1), COS cells alone (lane 2), and spleen samples from Klf3 knockout and heterozygous littermates (lanes 3 and 4, respectively). The right panels (lanes 5 to 18) show EMSAs using the β-major globin gene promoter −90 CACCC box. The bands generated by Klf3, Sp1, and Sp3 are indicated by arrows and are supershifted by appropriate antisera.
FIG. 2.
FIG. 2.
Klf3/ mice have reduced fat mass compared to wild-type mice. (A) Peritoneal cavity of wild-type and Klf3/ mice showing ovarian (black arrows) and retroperitoneal (blue arrows) white adipose tissue (WAT). (B) Organs were dissected from 12-week-old mice. A reduction in size was seen in Klf3/ white adipose tissue samples, while the gross morphology of the brown adipose tissue (BAT) and liver appeared similar between genotypes. (C) Relative weights of various organs. Values are plotted as a percentage of body weight at 12 weeks of age. The results are expressed as means plus SEM from nine wild-type, five Klf3+/, and eight Klf3/ male mice. *, P < 0.001 for Klf3/ versus wild-type/Klf3 +/− mice. epi, epididymal; RP, retroperitoneal. (D and E) Reduced subcutaneous white adipose tissue in Klf3/ neonates. Transverse sections were taken from the neck and scapula of wild-type, heterozygous, and Klf3/ mice at 4 days of age (n = 3 for each genotype). Images in panel D are at a magnification of ×40. Panel E shows sequential sections taken at the upper, middle, and lower torso at a magnification of ×8 (n = 3 for each genotype). The unstained rings underlying the skin represent areas of subcutaneous white adipose tissue. Brown adipose tissue is indicated by arrows in the lower panel. Sections were stained with H-E.
FIG. 3.
FIG. 3.
White adipose tissue from Klf3/ mice has smaller and fewer adipocytes. (A) Histological sections of epididymal white adipose tissue were stained with H-E. (B) Size distribution of adipocytes isolated from the epididymal white adipose tissue of wild-type, Klf3+/, and Klf3/ mice. Adipocytes were isolated by collagenase digestion and fixed with osmium tetroxide (n = 3 for each genotype). Adipocyte diameter was determined for 885 wild-type, 1,037 Klf3 +/−, and 1,506 Klf3/ adipocytes using Photoshop software. (C) DNA content was used as a measure of cell number. Results are expressed as means plus SEM of five animals per genotype. *, P < 0.001 for Klf3/ versus wild-type/Klf3+/ mice. WAT, white adipose tissue.
FIG. 4.
FIG. 4.
Enhanced adipocyte differentiation in Klf3-deficient cells. Fibroblasts derived from E14.5 wild-type (+/+) and Klf3 knockout (−/−) mouse embryos were induced to undergo adipocyte differentiation. Cells were stained with Oil Red O and counterstained with hematoxylin on day 8. Images are representative of at least three independent experiments.
FIG. 5.
FIG. 5.
Klf3 expression during 3T3-L1 adipocyte differentiation. (A) Total RNA was extracted from 3T3-L1 cells at the indicated times before and after induction of differentiation. The expression levels of Klf3, Klf2, Klf15, and C/ebpα were determined by quantitative real-time RT-PCR and normalized to 18S rRNA levels. These levels were then further normalized with respect to the level in 3T3-L1 cells at day 0, set at 1. Results are expressed as means plus SEM (n = 3). (B and C) Nuclear extracts were made from cells at day 0 (preadipocytes) and day 10 (adipocytes) of 3T3-L1 differentiation. An EMSA using a double-stranded oligonucleotide probe containing a CACCC sequence shows that Klf3 is present in preadipocytes and reduced in adipocytes (B). Anti-Klf3 antibody supershift reactions confirm that these species are Klf3 (lanes 2 and 4). Note that supershift of the Klf3 band reveals the presence of another CACCC box binding protein that runs similarly to Klf3. All data are representative of at least three independent experiments. Klf3 protein was detected by Western blot analysis using an anti-Klf3 antibody (C). β-Actin was used as a loading control. Duplicates are shown for each condition. All data are representative of at least three independent experiments.
FIG. 6.
FIG. 6.
Reduced adipocyte differentiation in 3T3-L1 cells stably expressing Klf3. (A) 3T3-L1 preadipocytes were retrovirally infected with empty vector (EV), Klf3, or Klf3ΔDL and subjected to Oil Red O staining to assess for lipid accumulation at day 5 of differentiation. Macroscopic (upper panel) and microscopic (magnification, ×100; lower panel) views are shown. Images are representative of at least three independent experiments. (B) 3T3-L1 cells were retrovirally infected with EV, Klf3, or Klf3ΔDL and differentiated. Nuclear extracts were prepared and subjected to Western blot analysis using the indicated antibodies. All data are representative of at least three independent experiments.
FIG. 7.
FIG. 7.
C/ebpα is derepressed in the absence of Klf3 and CtBP. Quantitative real-time RT-PCR analysis of wild-type (+/+) and Klf3 −/− white adipose tissue and MEFs (A), CtBP+/− and CtBP−/− MEFs (B), and wild-type and Klf3−/− white adipose tissue (C). Expression levels were normalized to the level of 18S rRNA. These levels were then further normalized with respect to the level in wild-type sample or CtBP+/− MEFs, set at 1. Error bars indicate SEM. P values are defined as follows, and significant differences are indicated by asterisks: <0.05 for Klf3−/− versus wild-type (A; n = 4 for each genotype), <0.05 for CtBP−/− versus CtBP+/− (B; n = 3 for each genotype), and <0.05 for Klf3−/− versus wild-type (C; n = 3 for each genotype).
FIG. 8.
FIG. 8.
Klf3 binds at to the C/ebpα promoter. 3T3-L1 preadipocytes were fixed and chromatin material was subjected to ChIP analysis. Chromatin was immunoprecipitated using an anti-Klf3 antibody or rabbit serum as a negative control. Primers used for real-time RT-PCR were targeted to various regions spaced 1 kb apart along the C/ebpα promoter.

References

    1. Balasubramanian, P., L.-J. Zhao, and G. Chinnadurai. 2003. Nicotinamide adenine dinucleotide stimulates oligomerization, interaction with adenovirus E1A and an intrinsic dehydrogenase activity of CtBP. FEBS Lett. 537157-160. - PubMed
    1. Banerjee, S. S., M. W. Feinberg, M. Watanabe, S. Gray, R. L. Haspel, D. J. Denkinger, R. Kawahara, H. Hauner, and M. K. Jain. 2003. The Kruppel-like factor KLF2 inhibits peroxisome proliferator-activated receptor-gamma expression and adipogenesis. J. Biol. Chem. 2782581-2584. - PubMed
    1. Bartz, R., J. Seemann, J. K. Zehmer, G. Serrero, K. D. Chapman, R. G. Anderson, and P. Liu. 2007. Evidence that mono-ADP-ribosylation of CtBP1/BARS regulates lipid storage. Mol. Biol. Cell 183015-3025. - PMC - PubMed
    1. Bieker, J. J. 1996. Isolation, genomic structure, and expression of human erythroid Kruppel-like factor (EKLF). DNA Cell Biol. 15347-352. - PubMed
    1. Bieker, J. J. 2001. Kruppel-like factors: three fingers in many pies. J. Biol. Chem. 27634355-34358. - PubMed

Publication types

MeSH terms

LinkOut - more resources