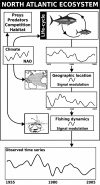
Complex interplays among population dynamics, environmental forcing, and exploitation in fisheries
- PMID: 18391220
- PMCID: PMC2291108
- DOI: 10.1073/pnas.0709034105
Complex interplays among population dynamics, environmental forcing, and exploitation in fisheries
Abstract
The patterns of variations in fisheries time series are known to result from a complex combination of species and fisheries dynamics all coupled with environmental forcing (including climate, trophic interactions, etc.). Disentangling the relative effects of these factors has been a major goal of fisheries science for both conceptual and management reasons. By examining the variability of 169 tuna and billfish time series of catch and catch per unit effort (CPUE) throughout the Atlantic as well as their linkage to the North Atlantic Oscillation (NAO), we find that the importance of these factors differed according to the spatial scale. At the scale of the entire Atlantic the patterns of variations are primarily spatially structured, whereas at a more regional scale the patterns of variations were primarily related to the fishing gear. Furthermore, the NAO appeared to also structure the patterns of variations of tuna time series, especially over the North Atlantic. We conclude that the patterns of variations in fisheries time series of tuna and billfish only poorly reflect the underlying dynamics of these fish populations; they appear to be shaped by several successive embedded processes, each interacting with each other. Our results emphasize the necessity for scientific data when investigating the population dynamics of large pelagic fishes, because CPUE fluctuations are not directly attributable to change in species' abundance.
Conflict of interest statement
The authors declare no conflict of interest.
Figures


References
-
- Cushing DH, Dickson RR. The biological response in the sea to climatic changes. Adv Mar Biol. 1976;14:1–122.
-
- Ravier C, Fromentin JM. Long-term fluctuations in the eastern Atlantic and Mediterranean bluefin tuna population. ICES. J Mar Sci. 2001;58:1299–1317.
-
- Hjort J. Fluctuations in the great fisheries of northern Europe viewed in the light of biological research. Rapp P-V Reun Cons Int Explor Mer. 1914;20:1–227.
-
- Lehodey P, Bertignac M, Hampton J, Lewis A, Picaut J. El Nino Southern Oscillation and tuna in the western Pacific. Nature. 1997;389:715–718.
-
- Planque B, Frédou T. Temperature and the recruitment of Atlantic cod (Gadus morhua) Can J Fish Aquat Sci. 1999;56:2069–2077.
Publication types
MeSH terms
LinkOut - more resources
Full Text Sources

