. 2008 Apr;64(Pt 4):425-35.
doi: 10.1107/S0907444908001741. Epub 2008 Mar 19.

A 7μm mini-beam improves diffraction data from small or imperfect crystals of macromolecules

Affiliations

A 7μm mini-beam improves diffraction data from small or imperfect crystals of macromolecules

Ruslan Sanishvili et al. Acta Crystallogr D Biol Crystallogr. 2008 Apr.

Abstract

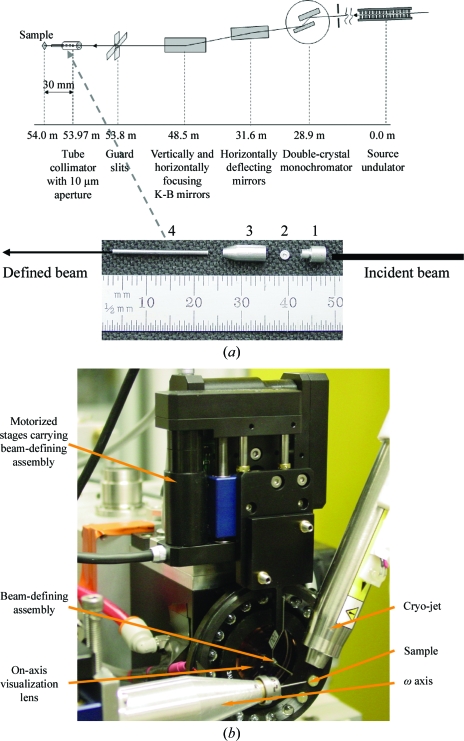
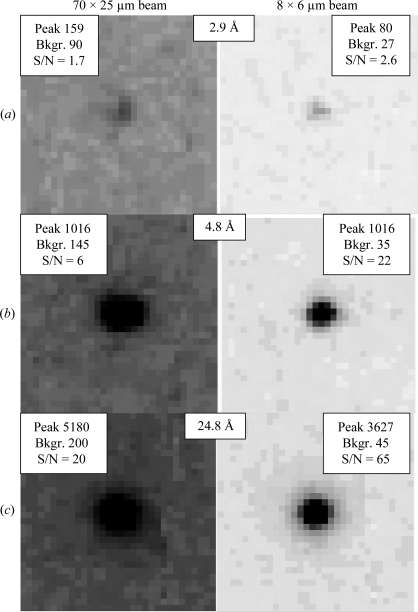
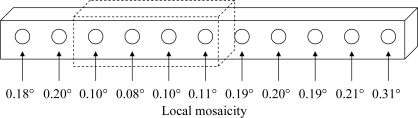
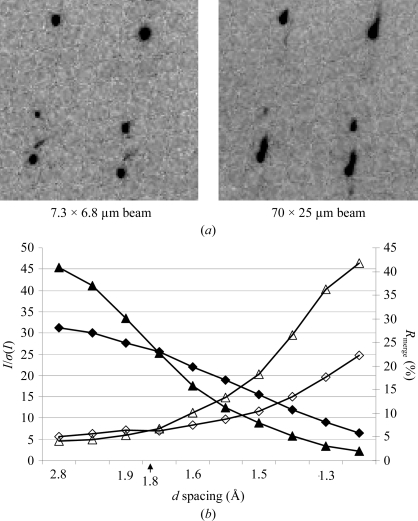
A simple apparatus for achieving beam sizes in the range 5-10 μm on a synchrotron beamline was implemented in combination with a small 125 x 25 μm focus. The resulting beam had sufficient flux for crystallographic data collection from samples smaller than 10 x 10 x 10 μm. Sample data were collected representing three different scenarios: (i) a complete 2.0 data set from a single strongly diffracting microcrystal, (ii) a complete and redundant 1.94 A data set obtained by merging data from six microcrystals and (iii) a complete 2.24 A data set from a needle-shaped crystal with less than 12 x 10 μm cross-section and average diffracting power. The resulting data were of high quality, leading to well refined structures with good electron-density maps. The signal-to-noise ratios for data collected from small crystals with the mini-beam were significantly higher than for equivalent data collected from the same crystal with a 125 x 25 μm beam. Relative to this large beam, use of the mini-beam also resulted in lower refined crystal mosaicities. The mini-beam proved to be advantageous for inhomogeneous large crystals, where better ordered regions could be selected by the smaller beam.


Figures

Figure 1
Figure 1
Mini-beam apparatus. (a) Location of the beamline optical elements relative to the X-ray source and the sample on beamline 23ID-B. All distances are shown for the centers of the elements except for the mirrors: each rectangle in the figure represents a pair of mirrors and the indicated distance is the average of the center distances in the pair. Details of the mini-beam apparatus are shown below the beamline schematic and its placement is indicated with a dashed arrow. 1, upstream scatter guard; 2, beam-defining aperture; 3, housing for beam-defining aperture; 4, downstream scatter guard. (b) Mini-beam apparatus in the sample environment. The mini-beam apparatus is positioned between the on-axis visualization lens and the sample. The beam stop is not visible as it is automatically lowered when the hutch door is open.
Figure 2
Figure 2
Lysozyme (left) and thaumatin (right) crystals and electron densities. The single lysozyme crystal (15 × 7 × 7 µm) was used for the experiment depicted. The thaumatin microcrystals were spread over the MiTeGen mount. Refined models and electron-density maps correspond to data sets from microcrystals with the mini-beam (above) and large crystals with a large beam (below). |2F oF c| electron densities are contoured at the r.m.s. density level.
Figure 3
Figure 3
Comparison of mini-beam and large-beam data from a needle-shaped crystal. I/σ(I) (solid symbols) and R merge (open symbols) are plotted for data sets collected from a thioesterase crystal with the mini-beam (triangles; TENS) and with a large beam (diamonds; TENL). Owing to higher background and a poorer signal-to-noise ratio, the TENL data have a reduced effective diffraction limit and overall poorer statistics than the TENS mini-beam data.
Figure 4
Figure 4
Comparison of signal-to-noise ratios for diffraction from a needle-shaped thioesterase crystal obtained with a large beam (left column) and with the mini-beam (right column). All panels are depicted with the same gray levels (0→344 counts, white→black). For each of the (a) high, (b) medium and (c) low resolutions, identical reflections are compared from the large-beam and mini-beam data sets. In the corner insets, the peak intensity (peak), average background around the spot (Bkgr.) and signal-to-noise ratio (S/N) are shown. S/N was calculated by summing the four largest pixel values in the diffraction spot and dividing by four times the average background around the spot. To ensure that the largest pixel values were chosen for both beams, adjacent diffraction images were also inspected.
Figure 5
Figure 5
Variation of mosaicity within a crystal. The large rod-shaped lysozyme crystal used for mosaicity measurements is drawn. The circles and arrows indicate the spots at which six diffraction images were recorded. The crystal was translated 30 µm between spots. Mosaicity estimates are as refined in HKL-2000. The dashed box indicates the best region of the crystal.
Figure 6
Figure 6
Effect of beam size on data from a large inhomogeneous lysozyme crystal. (a) Identical region of reciprocal space imaged with the mini-beam (left) and with the large beam (right). (b) Comparison of data measured with the mini-beam (triangles) and a large beam (diamonds). I/σ(I) (solid symbols) and R merge (open symbols) are plotted. Data from the mini-beam within a 1.8 Å limit are of higher quality, whereas beyond 1.8 Å the quality of the large-beam data is superior.
Figure 7
Figure 7
Effect of the beam size on data from a large homogeneous lysozyme crystal. (a) Schematic diagram of the experiment. The rectangle represents the 300 µm long rod-shaped lysozyme crystal. The beam size, shape and flux for each experiment are shown as ellipses and profiles. The peak flux is matched in the LLS2 and LLL3 experiments; the integrated intensity is matched in the LLS2 and LLL4 experiments. (b) Comparison of data quality. I/σ(I) (solid symbols) and R merge (open symbols) are plotted for the LLS2 (triangles), LLL3 (squares) and LLL4 (circles) experiments. Data from the large-beam experiments (LLL3 and LLL4) are superior to mini-beam data (LLS2) throughout the diffracting range of the experiment.

References

    1. Akey, D. L., Kittendorf, J. D., Giraldes, J. W., Fecik, R. A., Sherman, D. H. & Smith, J. L. (2006). Nature Chem. Biol.2, 537–542. - PubMed
    1. Bilderback, D. H., Hoffman, S. A. & Thiel, D. J. (1994). Science, 263, 201–203. - PubMed
    1. Brünger, A. T., Adams, P. D., Clore, G. M., DeLano, W. L., Gros, P., Grosse-Kunstleve, R. W., Jiang, J.-S., Kuszewski, J., Nilges, M., Pannu, N. S., Read, R. J., Rice, L. M., Simonson, T. & Warren, G. L. (1998). Acta Cryst. D54, 905–921. - PubMed
    1. Burmeister, W. P. (2000). Acta Cryst. D56, 326–341. - PubMed
    1. Cherezov, V. & Caffrey, M. (2006). J. Appl. Cryst.39, 604–606.

Publication types

MeSH terms

Substances