Meta-Analysis
. 2008 May;40(5):584-91.
doi: 10.1038/ng.125. Epub 2008 Apr 6.

Identification of ten loci associated with height highlights new biological pathways in human growth

Affiliations
Meta-Analysis

Identification of ten loci associated with height highlights new biological pathways in human growth

Guillaume Lettre et al. Nat Genet. 2008 May.

Abstract

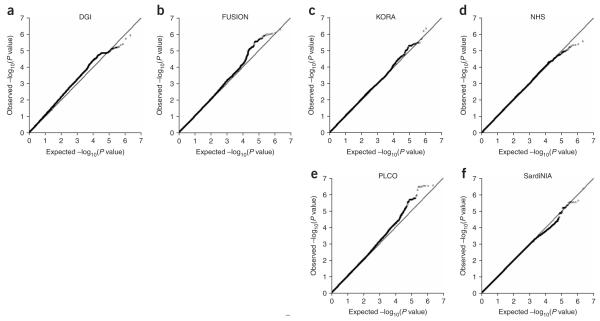
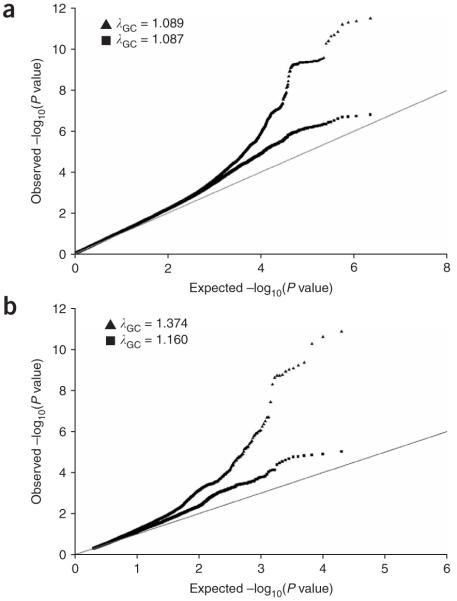
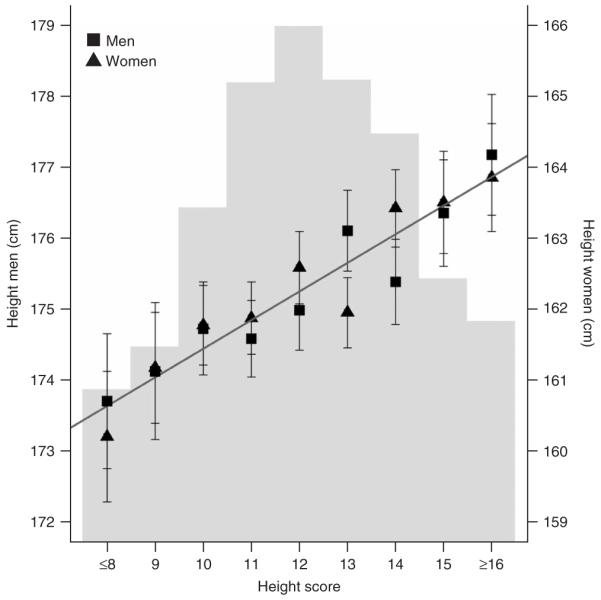
Height is a classic polygenic trait, reflecting the combined influence of multiple as-yet-undiscovered genetic factors. We carried out a meta-analysis of genome-wide association study data of height from 15,821 individuals at 2.2 million SNPs, and followed up the strongest findings in >10,000 subjects. Ten newly identified and two previously reported loci were strongly associated with variation in height (P values from 4 x 10(-7) to 8 x 10(-22)). Together, these 12 loci account for approximately 2% of the population variation in height. Individuals with < or =8 height-increasing alleles and > or =16 height-increasing alleles differ in height by approximately 3.5 cm. The newly identified loci, along with several additional loci with strongly suggestive associations, encompass both strong biological candidates and unexpected genes, and highlight several pathways (let-7 targets, chromatin remodeling proteins and Hedgehog signaling) as important regulators of human stature. These results expand the picture of the biological regulation of human height and of the genetic architecture of this classical complex trait.


Figures

Figure 1
Figure 1
Quantile-quantile plot of ~2.2 million SNPs for each of the six genome-wide association scans meta-analyzed. (a) DGI (n = 2,978). (b) FUSION (n = 2,371). (c) KORA (n = 1,644). (d) NHS (n = 2,286). (e) PLCO (n = 2,244). (f) SardiNIA (n = 4,305). Each black circle represents an observed statistic (defined as the -log10(P)) versus the corresponding expected statistic. The gray line corresponds to the null distribution.
Figure 2
Figure 2
Quantile-quantile plots supporting the presence of additional loci associated with height. (a) Plot of 2,260,683 SNPs from the meta-analysis of the six GWA scans (n = 15,821). Each black triangle represents an observed statistic (defined as the -log10(P)) versus the corresponding expected statistic. The black squares correspond to the distribution of test statistics after removing markers correlated to the 12 height signals with P < 5 ×10⁻⁷ described in Table 1. The gray line corresponds to the null distribution. (b) Association results from Weedon et al. provide independent evidence that the top 10,000 SNPs from our meta-analysis exceed the null expectations (gray line). We selected the top 10,000 SNPs from our meta-analysis before (black triangles) and after (black squares) removing SNPs marking the known height loci (identified by us and in the accompanying manuscript) and retrieved the corresponding P values from Weedon et al. We show one-tailed P values because we corrected for the direction of effects, if needed. Inflation factors are unusually high because the analysis is restricted to the top 10,000 SNPs, which are likely enriched for SNPs that are truly associated with height variation.
Figure 3
Figure 3
Analysis of combined effects. For each participant in the FINRISK97 panel with complete genotype at the 12 SNPs with P < 5 × 10⁻⁷ in Table 1 (n = 7,566), we counted the number of height-increasing alleles to create a height score. Individuals with ≤8 or ≥16 ‘tall’ alleles were grouped. For each height score group, in men and women separately, the mean ± 95% confidence interval is plotted. The axis for men is on the left and the axis for women is on the right (same scale). The regression line in dark gray indicates that, for both men and women, each additional ‘tall’ allele increases height by 0.4 cm. The light gray histogram in the background represents the relative fraction of individuals in each height score group (height score ≤8: 4.7%; height score 9: 6.2%; height score 10: 11.1%; height score 11: 15.5%; height score 12: 17.5%; height score 13: 15.6%; height score 14: 13.7%; height score 15: 8.6%; height score ≥16: 7.1%).

Comment in

  • Sizing up human height variation.
    Visscher PM. Visscher PM. Nat Genet. 2008 May;40(5):489-90. doi: 10.1038/ng0508-489. Nat Genet. 2008. PMID: 18443579 No abstract available.

Similar articles

  • Genome-wide association analysis identifies 20 loci that influence adult height.
    Weedon MN, Lango H, Lindgren CM, Wallace C, Evans DM, Mangino M, Freathy RM, Perry JR, Stevens S, Hall AS, Samani NJ, Shields B, Prokopenko I, Farrall M, Dominiczak A; Diabetes Genetics Initiative; Wellcome Trust Case Control Consortium; Johnson T, Bergmann S, Beckmann JS, Vollenweider P, Waterworth DM, Mooser V, Palmer CN, Morris AD, Ouwehand WH; Cambridge GEM Consortium; Zhao JH, Li S, Loos RJ, Barroso I, Deloukas P, Sandhu MS, Wheeler E, Soranzo N, Inouye M, Wareham NJ, Caulfield M, Munroe PB, Hattersley AT, McCarthy MI, Frayling TM. Weedon MN, et al. Nat Genet. 2008 May;40(5):575-83. doi: 10.1038/ng.121. Epub 2008 Apr 6. Nat Genet. 2008. PMID: 18391952 Free PMC article.
  • Identification of 15 loci influencing height in a Korean population.
    Kim JJ, Lee HI, Park T, Kim K, Lee JE, Cho NH, Shin C, Cho YS, Lee JY, Han BG, Yoo HW, Lee JK. Kim JJ, et al. J Hum Genet. 2010 Jan;55(1):27-31. doi: 10.1038/jhg.2009.116. Epub 2009 Nov 6. J Hum Genet. 2010. PMID: 19893584
  • Genetic regulation of adult stature.
    Lettre G. Lettre G. Curr Opin Pediatr. 2009 Aug;21(4):515-22. doi: 10.1097/MOP.0b013e32832c6dce. Curr Opin Pediatr. 2009. PMID: 19455035 Review.
  • Hundreds of variants clustered in genomic loci and biological pathways affect human height.
    Lango Allen H, Estrada K, Lettre G, Berndt SI, Weedon MN, Rivadeneira F, Willer CJ, Jackson AU, Vedantam S, Raychaudhuri S, Ferreira T, Wood AR, Weyant RJ, Segrè AV, Speliotes EK, Wheeler E, Soranzo N, Park JH, Yang J, Gudbjartsson D, Heard-Costa NL, Randall JC, Qi L, Vernon Smith A, Mägi R, Pastinen T, Liang L, Heid IM, Luan J, Thorleifsson G, Winkler TW, Goddard ME, Sin Lo K, Palmer C, Workalemahu T, Aulchenko YS, Johansson A, Zillikens MC, Feitosa MF, Esko T, Johnson T, Ketkar S, Kraft P, Mangino M, Prokopenko I, Absher D, Albrecht E, Ernst F, Glazer NL, Hayward C, Hottenga JJ, Jacobs KB, Knowles JW, Kutalik Z, Monda KL, Polasek O, Preuss M, Rayner NW, Robertson NR, Steinthorsdottir V, Tyrer JP, Voight BF, Wiklund F, Xu J, Zhao JH, Nyholt DR, Pellikka N, Perola M, Perry JR, Surakka I, Tammesoo ML, Altmaier EL, Amin N, Aspelund T, Bhangale T, Boucher G, Chasman DI, Chen C, Coin L, Cooper MN, Dixon AL, Gibson Q, Grundberg E, Hao K, Juhani Junttila M, Kaplan LM, Kettunen J, König IR, Kwan T, Lawrence RW, Levinson DF, Lorentzon M, McKnight B, Morris AP, Müller M, Suh Ngwa J, Purcell S, Rafelt S, Salem RM, Salvi E, Sanna S, Shi J, Sovio U, Thompson JR, Turchin MC, Vandenput L, Verla… See abstract for full author list ➔ Lango Allen H, et al. Nature. 2010 Oct 14;467(7317):832-8. doi: 10.1038/nature09410. Epub 2010 Sep 29. Nature. 2010. PMID: 20881960 Free PMC article.
  • Recent progress in the study of the genetics of height.
    Lettre G. Lettre G. Hum Genet. 2011 May;129(5):465-72. doi: 10.1007/s00439-011-0969-x. Epub 2011 Feb 22. Hum Genet. 2011. PMID: 21340692 Review.

Cited by

References

    1. Hirschhorn JN, Daly MJ. Genome-wide association studies for common diseases and complex traits. Nat. Rev. Genet. 2005;6:95–108. - PubMed
    1. The International HapMap Consortium A haplotype map of the human genome. Nature. 2005;437:1299–1320. - PMC - PubMed
    1. Wellcome Trust Case Control Consortium Genome-wide association study of 14,000 cases of seven common diseases and 3,000 shared controls. Nature. 2007;447:661–678. - PMC - PubMed
    1. Saxena R, et al. Genome-wide association analysis identifies loci for type 2 diabetes and triglyceride levels. Science. 2007;316:1331–1336. - PubMed
    1. Frayling TM, et al. A common variant in the FTO gene is associated with body mass index and predisposes to childhood and adult obesity. Science. 2007;316:889–894. - PMC - PubMed

Publication types