

Genome-wide association analysis identifies 20 loci that influence adult height
- PMID: 18391952
- PMCID: PMC2681221
- DOI: 10.1038/ng.121
Genome-wide association analysis identifies 20 loci that influence adult height
Abstract
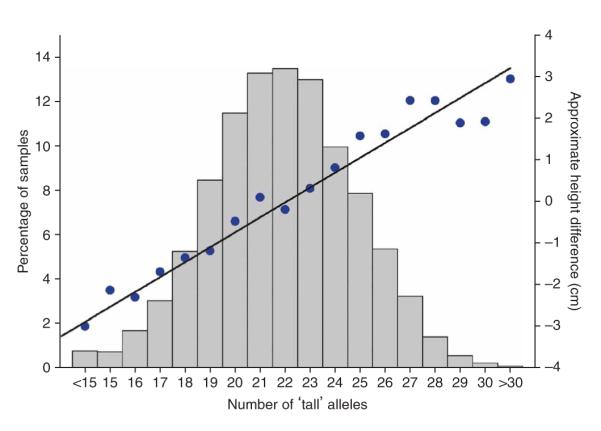
Adult height is a model polygenic trait, but there has been limited success in identifying the genes underlying its normal variation. To identify genetic variants influencing adult human height, we used genome-wide association data from 13,665 individuals and genotyped 39 variants in an additional 16,482 samples. We identified 20 variants associated with adult height (P < 5 x 10(-7), with 10 reaching P < 1 x 10(-10)). Combined, the 20 SNPs explain approximately 3% of height variation, with a approximately 5 cm difference between the 6.2% of people with 17 or fewer 'tall' alleles compared to the 5.5% with 27 or more 'tall' alleles. The loci we identified implicate genes in Hedgehog signaling (IHH, HHIP, PTCH1), extracellular matrix (EFEMP1, ADAMTSL3, ACAN) and cancer (CDK6, HMGA2, DLEU7) pathways, and provide new insights into human growth and developmental processes. Finally, our results provide insights into the genetic architecture of a classic quantitative trait.
Figures


Comment in
-
Sizing up human height variation.Nat Genet. 2008 May;40(5):489-90. doi: 10.1038/ng0508-489. Nat Genet. 2008. PMID: 18443579 No abstract available.
References
-
- Macgregor S, Cornes BK, Martin NG, Visscher PM. Bias, precision and heritability of self-reported and clinically measured height in Australian twins. Hum. Genet. 2006;120:571–580. - PubMed
-
- Preece MA. The genetic contribution to stature. Horm. Res. 1996;45:56–58. - PubMed
-
- Silventoinen K, et al. Heritability of adult body height: a comparative study of twin cohorts in eight countries. Twin Res. 2003;6:399–408. - PubMed
Publication types
MeSH terms
Substances
Grants and funding
- G9521010/MRC_/Medical Research Council/United Kingdom
- G0600705/MRC_/Medical Research Council/United Kingdom
- 077011/WT_/Wellcome Trust/United Kingdom
- 077016/WT_/Wellcome Trust/United Kingdom
- 076113/WT_/Wellcome Trust/United Kingdom
- PG02/128/BHF_/British Heart Foundation/United Kingdom
- G9521010D/MRC_/Medical Research Council/United Kingdom
- G0701863/MRC_/Medical Research Council/United Kingdom
- 090532/WT_/Wellcome Trust/United Kingdom
- PG/02/128/14470/BHF_/British Heart Foundation/United Kingdom
- MC_U106188470/MRC_/Medical Research Council/United Kingdom
- FS/05/061/19501/BHF_/British Heart Foundation/United Kingdom
- G9521010(63660)/MRC_/Medical Research Council/United Kingdom
LinkOut - more resources
Full Text Sources
Molecular Biology Databases
Miscellaneous
