. 2008 Dec;57(12):1807-16.
doi: 10.1007/s00262-008-0508-3. Epub 2008 Apr 5.

Progression of intracranial glioma disrupts thymic homeostasis and induces T-cell apoptosis in vivo

Affiliations

Progression of intracranial glioma disrupts thymic homeostasis and induces T-cell apoptosis in vivo

Abdeljabar El Andaloussi et al. Cancer Immunol Immunother. 2008 Dec.

Abstract

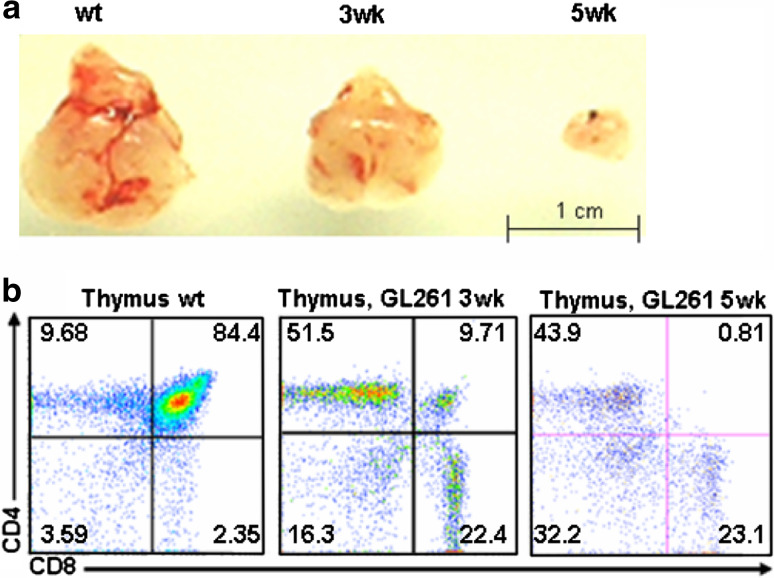
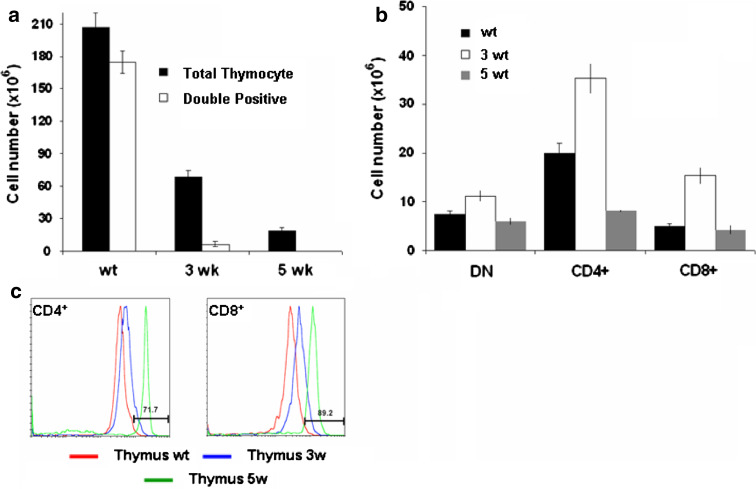
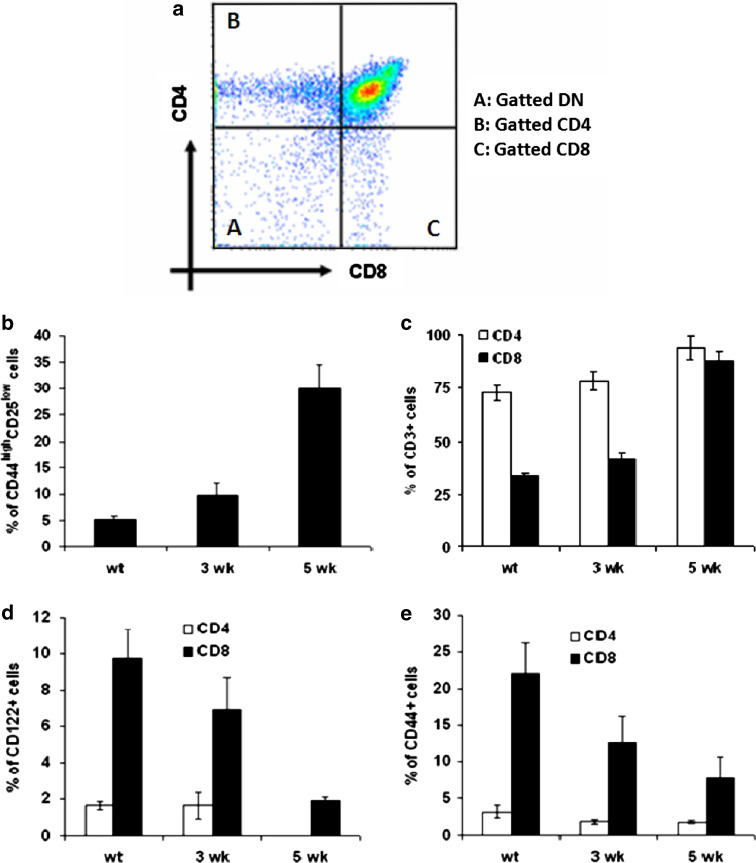
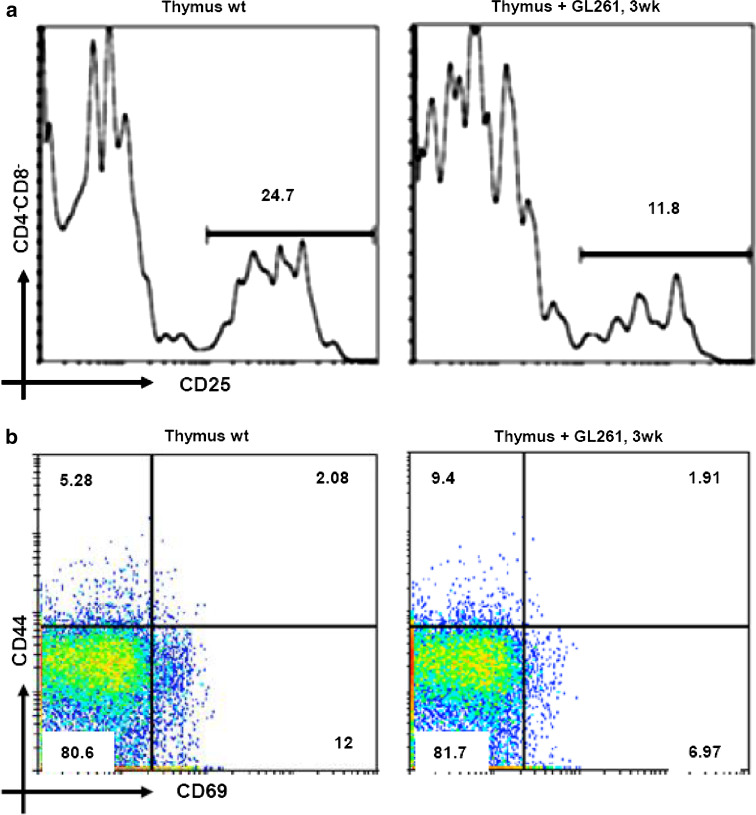
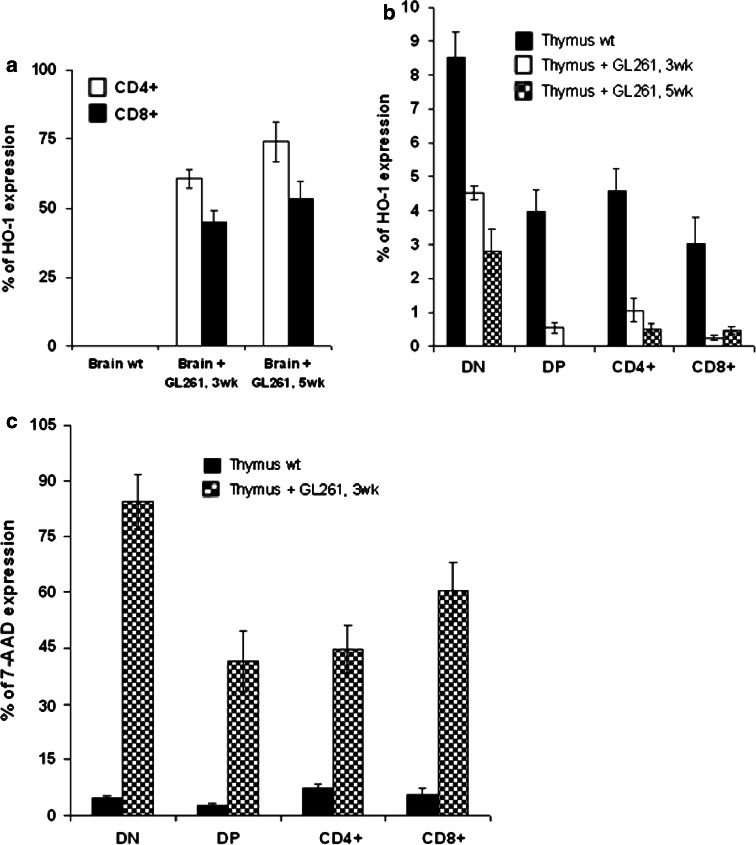
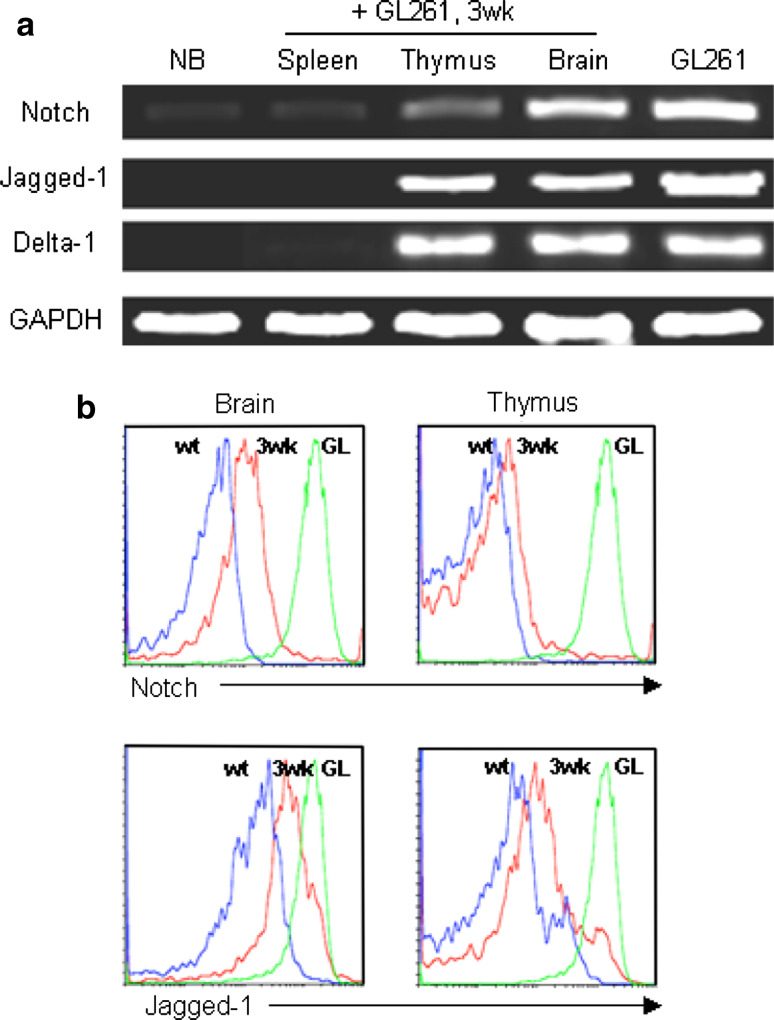
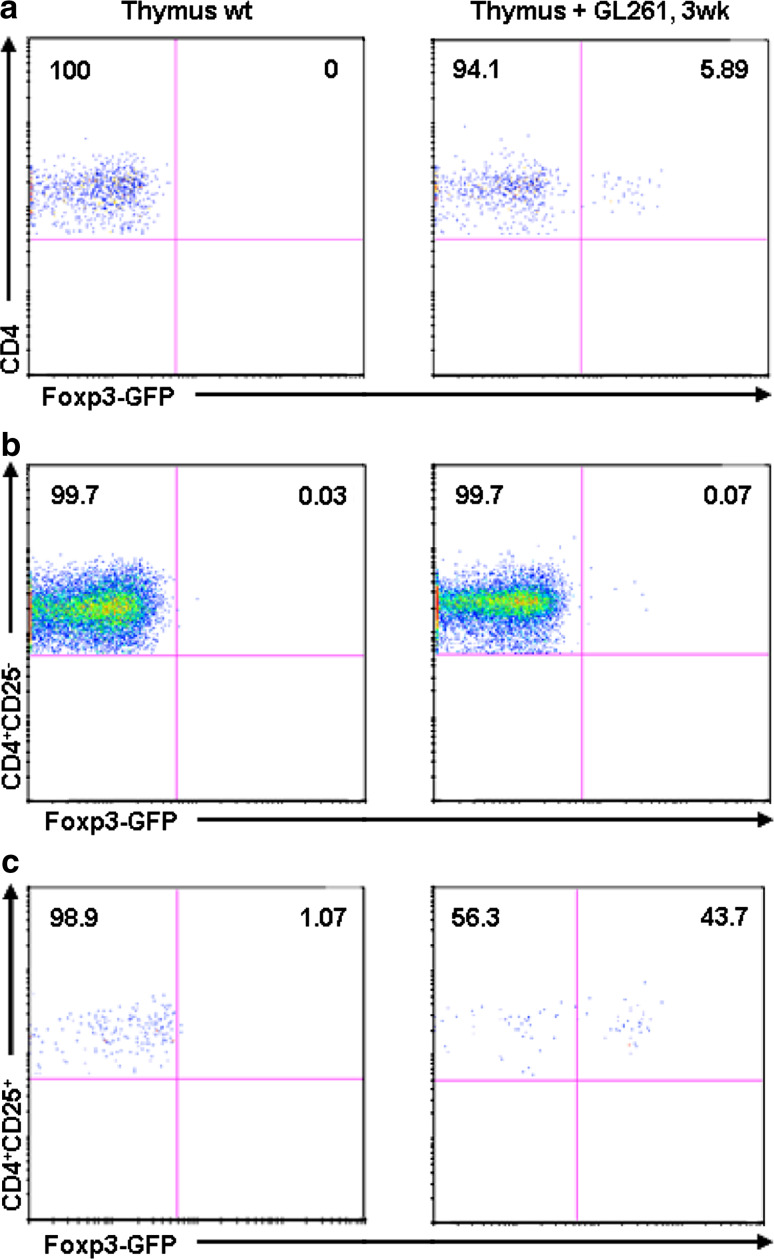
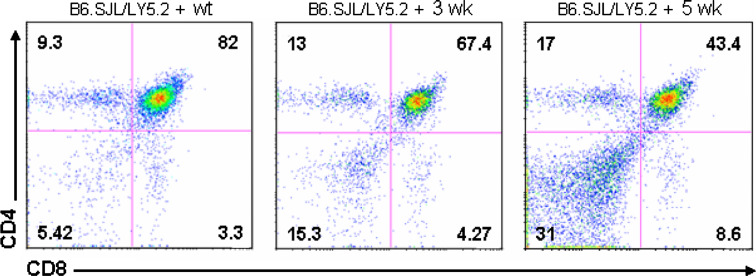
The thymus is the site where all T-cell precursors develop, mature, and subsequently leave as mature T-cells. Since the mechanisms that mediate and regulate thymic apoptosis are not fully understood, we utilized a syngenic GL261 murine glioma model to further elucidate the fate of T-cells in tumor bearing C57BL/6 mice. First, we found a dramatic reduction in the size of the thymus accompanied by a decrease in thymic cellularity in response to glioma growth in the brains of affected mice. There was a marked reduction of double positive subset and an increase in the frequency of CD4(+) and CD8(+) single positive T-cell subsets. Analysis of double negative thymocytes showed an increase in the accumulation of CD44(+) cells. In contrast, there was a marked loss of CD44 and CD122 expression in CD4(+) and CD8(+) subsets. The growth of intracranial tumors was also associated with decreased levels of HO-1, a mediator of anti-apoptotic function, and increased levels of Notch-1 and its ligand, Jagged-1. To determine whether thymic atrophy could be due to the effect of Notch and its ligand expression by glioma in vivo, we performed a bone marrow transplant experiment. Our results suggest that Notch-1 and its ligand Jagged-1 can induce apoptosis of thymocytes, thereby influencing thymic development, immune system homeostasis, and function of the immune cells in a model of experimental glioma.


Figures

Fig. 1
Fig. 1
Phenotypic analysis of the thymus: a macroscopic observation of the thymus size from glioma bearing mice at 3 and 5 weeks compared to littermate control; b single cell suspensions of thymocytes from wt, 3 and 5 week glioma bearing C57BL/6 mice were counted, stained with CD4 and CD8 monoclonal antibodies, and analyzed by flow cytometry. The mean fluorescence intensity ± SD of frequency of each subset of thymocyte is indicated in each quadrant
Fig. 2
Fig. 2
T-cell development in the thymus of glioma bearing mice: a absolute numbers of total thymocytes and double positive subset; b absolute number of thymocyte populations (DP, DN cell, SP-CD4+ or SP-CD8+). The number of thymocytes in each population was calculated by multiplying the percentage of each population by the total number of thymocytes; c Comparison of surface expression of CD4 and CD8 in SP thymocytes in glioma bearing mice compared wt littermate. Cells were stained with CD4 and CD8 for definition of the developmental stage. Values represent the mean fluorescence intensity ± SD
Fig. 3
Fig. 3
Phenotype profiles of thymocytes harvested from glioma bearing mice at 3 and 5 weeks, and from wt control littermate: a flow cytometry plots depicting appropriate gating of DN thymocytes, SP CD4+and SP CD8+ T-cells. The DN cells stained with CD44 and CD25 and the frequency of CD44highCD25low were compared between wt, 3 and 5 week glioma bearing mice (b). Thymocytes stained for CD4 and CD8 and analyzed with flow cytometry. The histograms shown cells stained with c CD3, d CD122, and e CD44. The percentage of positive cells for each marker is given in each dot plot. Values represent the mean fluorescence intensity ± SD
Fig. 4
Fig. 4
DN Thymocyte expression profiles: a analysis of CD25 expression by flow cytometry in total DN (CD4-CD8-). Flow cytometry analysis with CD69 vs. CD44 monoclonal antibodies in total thymocyte of glioma bearing mice (3 weeks) and wt littermate control (b). The expression levels of these two markers was absent in thymocytes at 5 weeks due to cell death at this stage. The percentage of positive cells for each marker is given in each dot plot. Values represent the mean fluorescence intensity ± SD
Fig. 5
Fig. 5
Apoptosis of T-cells of glioma bearing mice: a flow cytometry analysis of gated CD4+ and CD8+ cells infiltrating brain of glioma bearing mice (3 and 5 week) compared to littermate brain wt control, stained for CD4, CD8 and HO-1. The result was recapitulated in a histogram; b expression of HO-1 in gated thymocytes DN, DP, SP CD4+ and SP CD8+ analyzed with flow cytometry and represented in a histogram; c representative histogram of 7-AAD uptake detected by flow cytometry in different thymocytes subsets (DN, DP and SP) stained for CD4, CD8 and 7-AAD. Values represent the mean fluorescence intensity ± SD
Fig. 6
Fig. 6
Notch and its ligand expression by glioma cell line: a RT-PCR analysis of Notch and its ligand (Jagged-1 and Delta-1) expression in brain, thymus and spleen of glioma bearing mice. Normal brain was used as negative control and GL261 (GL) glioma cell line, positive control; b in vivo analysis of Notch and its ligand Jagged-1 expression by flow cytometry in brain and thymus of glioma bearing mice and wt shown in histogram
Fig. 7
Fig. 7
Treg homeostasis in the thymus of glioma bearing mice: a dot plots generated by an FACS analysis after staining with monoclonal antibody anti-CD4 versus GFP expression in Foxp3-GFP (C57BL/6 background) mice compared to the wt littermate control of the same genotype; b, c show Foxp3-GFP expression in CD4+CD25 and CD4+CD25+. The mean fluorescence intensity for each marker is given in each dot plot. Values represent the mean fluorescence intensity ± SD
Fig. 8
Fig. 8
Bone marrow reconstitution. Bone marrow cells (Ly5.1+) from wild type or glioma bearing mice were transferred into irradiated B6.SJL (Ly5.2+). At three and five weeks after transplantation, isolated thymocytes were analyzed by flow cytometry for CD4 and CD8 expression. Values represent the mean fluorescence intensity ± SD

References

    1. Ribatti D, Crivellato E, Vacca A. Miller’s seminal studies on the role of thymus in immunity. Clin Exp Immunol. 2006;144:371–375. doi: 10.1111/j.1365-2249.2006.03060.x. - DOI - PMC - PubMed
    1. Anderson G, Jenkinson EJ. Lymphostromal interactions in thymic development and function. Nat Rev Immunol. 2001;1:31–40. doi: 10.1038/35095500. - DOI - PubMed
    1. Miele L, Osborne B. Arbiter of differentiation and death: Notch signaling meets apoptosis. J Cell Physiol. 1999;181:393–409. doi: 10.1002/(SICI)1097-4652(199912)181:3<393::AID-JCP3>3.0.CO;2-6. - DOI - PubMed
    1. Artavanis-Tsakonas S, Rand MD, Lake RJ. Notch signaling: cell fate control and signal integration in development. Science. 1999;284:770–776. doi: 10.1126/science.284.5415.770. - DOI - PubMed
    1. Martinez Arias A, Zecchini V, Brennan K. CSL-independent Notch signalling: a checkpoint in cell fate decisions during development? Curr Opin Genet Dev. 2002;12:524–533. doi: 10.1016/S0959-437X(02)00336-2. - DOI - PubMed

Publication types

MeSH terms