

Angiotensin II- and glucose-stimulated extracellular matrix production: mediation by the insulin-like growth factor (IGF) axis in a murine mesangial cell line
- PMID: 18392786
- PMCID: PMC2684556
- DOI: 10.1007/s12020-008-9055-0
Angiotensin II- and glucose-stimulated extracellular matrix production: mediation by the insulin-like growth factor (IGF) axis in a murine mesangial cell line
Abstract
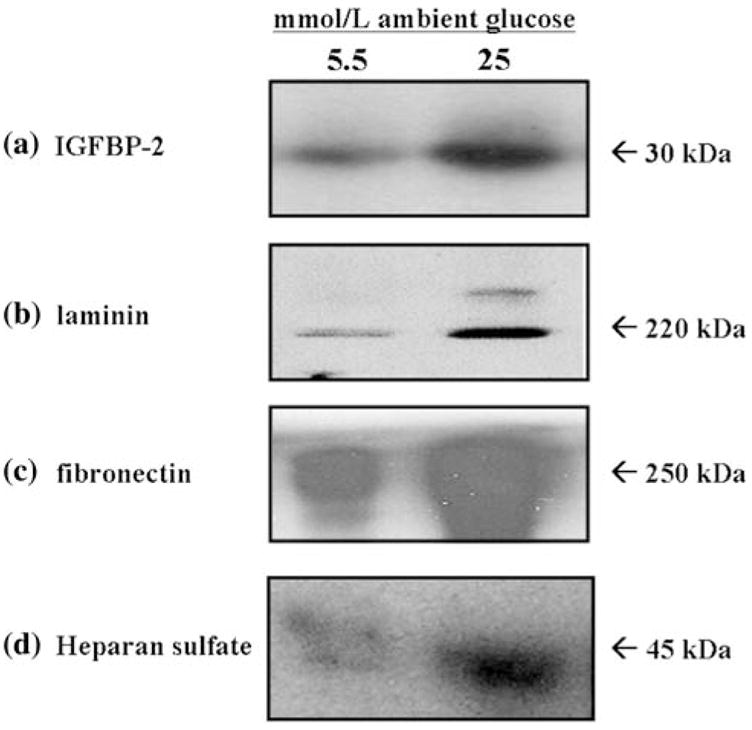
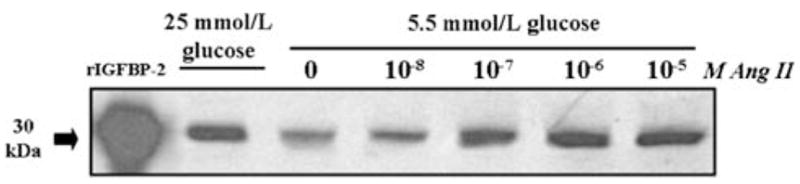
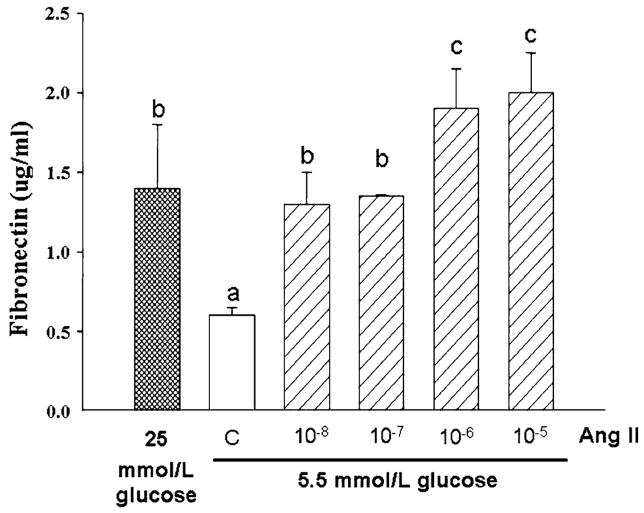
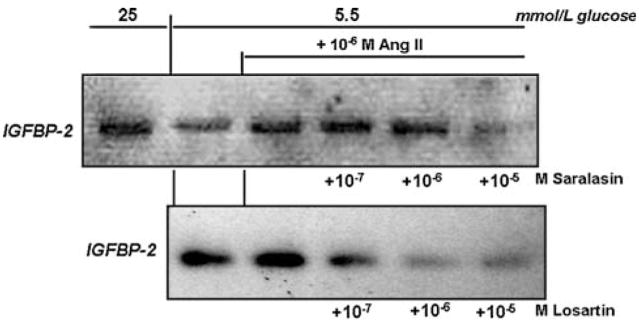
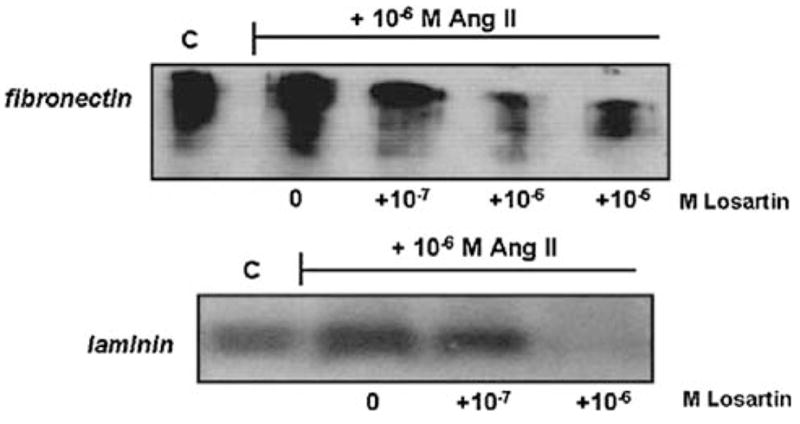
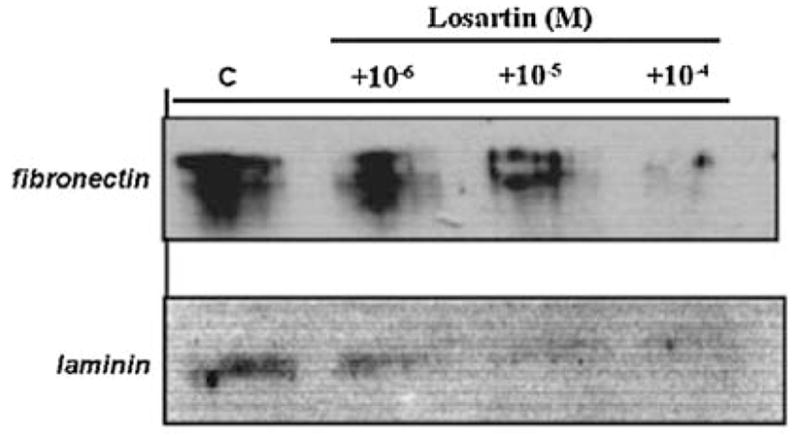
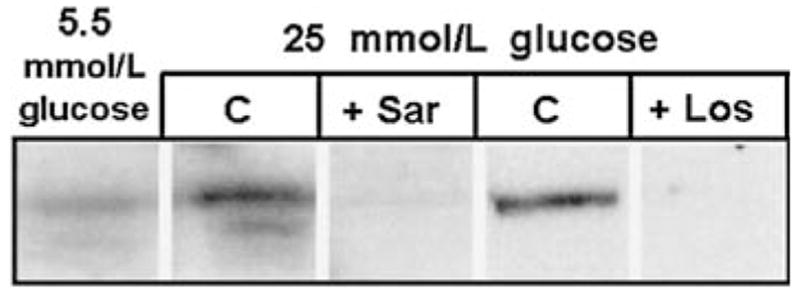
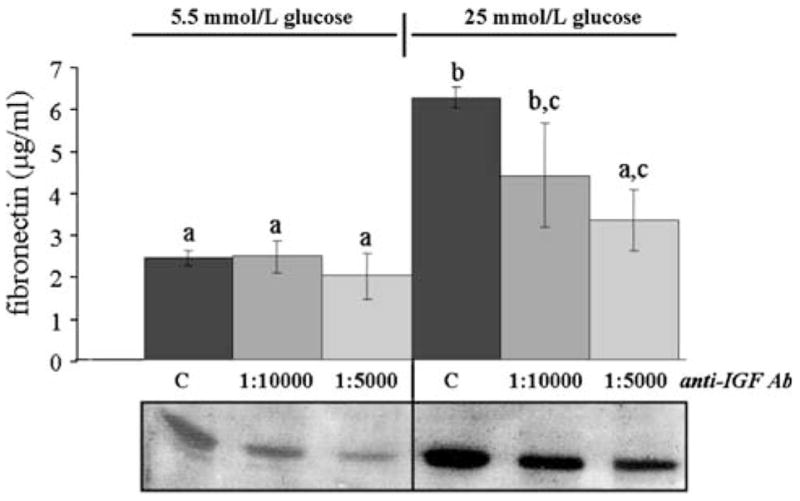
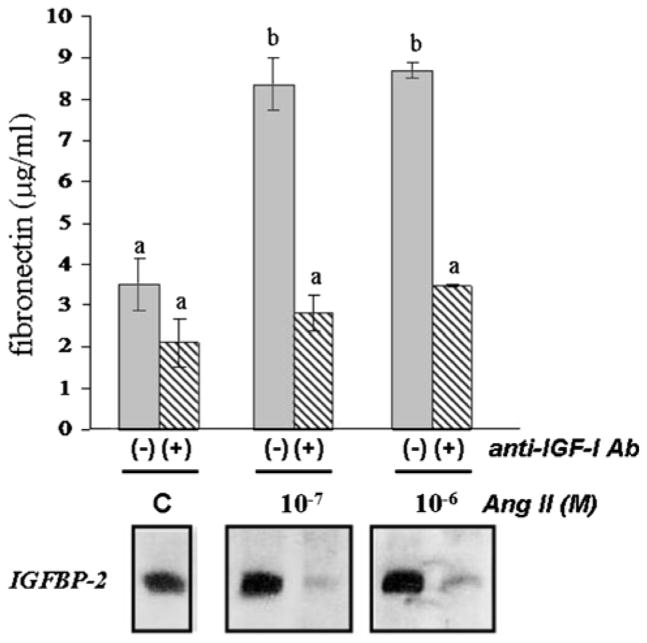
In diabetic nephropathy, glomerular mesangial cells exhibit aberrant anabolic activity that includes excessive production of extracellular matrix (ECM) proteins, leading to crowding of filtration surface areas and possible renal failure. In the present study, a murine mesangial cell line (MES-13 cells) was studied to determine the roles of the renin-angiotensin system (RAS) and the insulin-like growth factor (IGF) axis in the anabolic response to elevated glucose levels. Culture of MES-13 cells in medium containing supra-physiological glucose concentrations (>5.5 mmol/l) resulted in increased production of ECM proteins including laminin, fibronectin, and heparan sulfate proteoglycan with concurrent increases in IGF-binding protein (IGFBP)-2 production. These responses were blocked by the angiotensin receptor antagonists saralasin and losartan, while exogenous angiotensin II (Ang II) treatment directly stimulated increases in ECM and IGFBP-2. In all experiments, IGFBP-2 levels were correlated with anabolic activity implicating IGFBP-2 as a possible mediator in cellular responses to high glucose and Ang II. Such mediation appears to involve IGFBP-2 modulation of IGF-I signaling, since all responses to high glucose or Ang II were blocked by immuno-neutralization of IGF-I. These data suggest alterations in the IGF axis as key mechanisms underlying nephropathic responses of mesangial cells to Ang II and high glucose.
Figures
Similar articles
-
High ambient glucose induces angiotensin-independent AT-1 receptor activation, leading to increases in proliferation and extracellular matrix accumulation in MES-13 mesangial cells.Biochem J. 2009 Sep 14;423(1):129-43. doi: 10.1042/BJ20082277. Biochem J. 2009. PMID: 19604148
-
Counteraction between angiotensin II and angiotensin-(1-7) via activating angiotensin type I and Mas receptor on rat renal mesangial cells.Regul Pept. 2012 Aug 20;177(1-3):12-20. doi: 10.1016/j.regpep.2012.04.002. Epub 2012 May 1. Regul Pept. 2012. PMID: 22561449
-
High glucose level and angiotensin II type 1 receptor stimulation synergistically amplify oxidative stress in renal mesangial cells.Sci Rep. 2019 Mar 26;9(1):5214. doi: 10.1038/s41598-019-41536-z. Sci Rep. 2019. PMID: 30914692 Free PMC article.
-
Role of angiotensin II in glucose-induced inhibition of mesangial matrix degradation.Diabetes. 1999 Oct;48(10):2066-73. doi: 10.2337/diabetes.48.10.2066. Diabetes. 1999. PMID: 10512375
-
Role of angiotensin II in diabetic nephropathy.Kidney Int Suppl. 2000 Sep;77:S93-8. doi: 10.1046/j.1523-1755.2000.07715.x. Kidney Int Suppl. 2000. PMID: 10997697 Review.
Cited by
-
Lignans from the bark of Eucommia ulmoides inhibited Ang II-stimulated extracellular matrix biosynthesis in mesangial cells.Chin Med. 2014 Feb 14;9(1):8. doi: 10.1186/1749-8546-9-8. Chin Med. 2014. PMID: 24524265 Free PMC article.
-
H(2)S inhibits hyperglycemia-induced intrarenal renin-angiotensin system activation via attenuation of reactive oxygen species generation.PLoS One. 2013 Sep 13;8(9):e74366. doi: 10.1371/journal.pone.0074366. eCollection 2013. PLoS One. 2013. PMID: 24058553 Free PMC article.
-
Signaling mechanisms in the regulation of renal matrix metabolism in diabetes.Exp Diabetes Res. 2012;2012:749812. doi: 10.1155/2012/749812. Epub 2012 Feb 19. Exp Diabetes Res. 2012. PMID: 22454628 Free PMC article. Review.
-
Loss of angiotensin-converting enzyme 2 leads to impaired glucose homeostasis in mice.Endocrine. 2008 Aug-Dec;34(1-3):56-61. doi: 10.1007/s12020-008-9110-x. Epub 2008 Oct 28. Endocrine. 2008. PMID: 18956256
-
Renin-angiotensin-aldosterone system blockade for cardiovascular diseases: current status.Br J Pharmacol. 2010 Jul;160(6):1273-92. doi: 10.1111/j.1476-5381.2010.00750.x. Br J Pharmacol. 2010. PMID: 20590619 Free PMC article. Review.
References
Publication types
MeSH terms
Substances
Grants and funding
LinkOut - more resources
Full Text Sources
Miscellaneous
