Comparative Study
. 2008 Jun 10;508(5):771-94.
doi: 10.1002/cne.21704.

Nucleus paragigantocellularis afferents in male and female rats: organization, gonadal steroid receptor expression, and activation during sexual behavior

Affiliations
Comparative Study

Nucleus paragigantocellularis afferents in male and female rats: organization, gonadal steroid receptor expression, and activation during sexual behavior

Joseph J Normandin et al. J Comp Neurol. .

Abstract

The supraspinal regulation of genital reflexes is poorly understood. The brainstem nucleus paragigantocellularis (nPGi) of rats is a well-established source of tonic inhibition of genital reflexes. However, the organization, gonadal steroid receptor expression, and activity of nPGi afferents during sex have not been fully characterized in male and female rats. To delineate the anatomical and physiological organization of nPGi afferents, the retrograde tracer Fluoro-Gold (FG) was injected into the nPGi of sexually experienced male and female rats. Animals engaged in sexual behavior 1 hour before sacrifice. Cells containing FG, estrogen receptor-alpha (ER(alpha)), androgen receptor (AR), and the immediate-early gene product Fos were identified immunocytochemically. Retrograde labeling from the nPGi was prominent in the bed nucleus of the stria terminalis, paraventricular nucleus (PVN), posterior hypothalamus, precommissural nucleus, deep mesencephalic nucleus, and periaqueductal gray (PAG) of both sexes. Sex differences were observed in the caudal medial preoptic area (MPO), with significantly more FG+ cells observed in males, and in the PAG and inferior colliculus, where significantly more FG+ cells were observed in females. The majority of regions that contained FG+ cells also contained ER(alpha) or AR, indicating sensitivity to gonadal steroids. The proportions of FG+ cells that co-localized with sex-induced Fos was high in the PVN of both sexes and high in the MPO of males but low in the PAG of both sexes despite the large number of PAG-nPGi output neurons and Fos+ cells in both sexes. The characterization of these afferents will lead to a further understanding of the neural regulation of genital reflexes.


Figures

Figure 1
Figure 1
Photomicrograph depicting a typical Fluorogold (FG) injection in the nucleus paragigantocellularis (nPGi) of the male (A) and female (B) rat. Note that FG injections are centered in the nPGi with little spread to surrounding regions. 4V=4th ventricle, py=pyramidal tract.
Figure 2
Figure 2
Plots of FG+ cells retrogradely labeled from the nPGi (black: ipsilateral to injection site, gray: solely contralateral to injection site). Also plotted are FG+ cells containing estrogen receptor alpha (ERα; pink), or androgen receptor (AR; blue) of a representative male (left side) and female (right side) rat in all sections examined, relative to Bregma.
Figure 2
Figure 2
Plots of FG+ cells retrogradely labeled from the nPGi (black: ipsilateral to injection site, gray: solely contralateral to injection site). Also plotted are FG+ cells containing estrogen receptor alpha (ERα; pink), or androgen receptor (AR; blue) of a representative male (left side) and female (right side) rat in all sections examined, relative to Bregma.
Figure 3
Figure 3
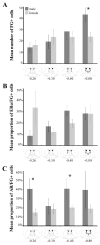
Mean number (± standard error of the mean (SEM)) of FG+ cells retrogradely labeled from the nPGi for four rostrocaudal levels of the medial preoptic area (MPO; A). The mean percentage (± SEM) of FG+ cells that also contained ERα (B) or AR (C) is also shown. Numbers below atlas images are millimeters relative to Bregma. Note that females have a higher number of FG+ cells in the rostral MPO, whereas males have a higher number of FG+ cells in the caudal MPO. Also note that females have a higher proportion of ERα/FG+ in the rostral-most level, whereas males have a higher proportion of ERα/FG+ cells in a caudal level. A higher proportion of AR/FG+ cells at all levels of the MPO were observed in males. * = significant male/female difference, p≤0.05; MPO=medial preoptic area.
Figure 4
Figure 4
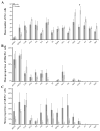
Mean number (± SEM) of FG+ cells retrogradely labeled from the nPGi in all regions with where dense labeling was observed (A). Mean percentage (± SEM) of FG+ cells that also contained ERα (B) or AR (C) are also shown. Note the regional specificity in sex differences in FG+ cells. Also note the similarity between the sexes in the proportion of ERα/FG+ cells, but the male-bias at almost all levels with respect to the proportion of AR/FG+ cells. * = significant male/female difference, p≤0.0031; r/cBNST= rostral/caudal bed nucleus of the stria terminalis, CeM=central amygdala, PVN=paraventricular nucleus, PH=posterior hypothalamus, PeF=perifornical nucleus, PrC=precommissural nucleus, PF=parafascicular thalamic nucleus, DpMe=deep mesencephalic nucleus, InCo=intercollicular nucleus, rSC=rostral superior colliculus, DpG=deep gray layer of the superior colliculus, ECIC=external cortex of the inferior colliculus, m5=motor root of the trigeminal nerve, LRt=lateral reticular nucleus, Sp5I=interpolar spinal trigeminal nucleus
Figure 5
Figure 5
Photomicrograph of a representative section of the paraventricular nucleus (PVN) in a male (A and C) and female (B and D) rat. C and D are higher magnifications of the area indicated by the box. Neurons stained brown contain FG retrogradely labeled from the nPGi, nuclei stained black contain AR and neurons stained brown with nuclei stained black contain both FG and AR. Note that both males and females have a similar high density of retrogradely labeled cells, and that some of these cells contain AR.
Figure 6
Figure 6
Mean number (± SEM) of FG+ cells retrogradely labeled from the nPGi for six rostrocaudal levels of the periaqueductal gray (PAG; A). The mean percentage (± SEM) of FG+ cells that also contained ERα (B) or AR (C) is also shown. Numbers below atlas images are millimeters relative to Bregma. Note that females have a higher number of FG labeled cells throughout the PAG, most notably in the dorsomedial subdivision of the PAG, and that females differed from males significantly at four rostrocaudal levels. Also note that males have a higher proportion of ERα/FG+ or AR/FG+ cells at almost all levels. * = significant male/female difference, p≤0.05
Figure 7
Figure 7
Plots of FG+ cells retrogradely labeled from the nPGi (black: ipsilateral to injection site; gray: solely contralateral to injection site), and FG+ cells also containing Fos (green) of representative male (left sides) and female (right side) rat in all sections examined.
Figure 7
Figure 7
Plots of FG+ cells retrogradely labeled from the nPGi (black: ipsilateral to injection site; gray: solely contralateral to injection site), and FG+ cells also containing Fos (green) of representative male (left sides) and female (right side) rat in all sections examined.
Figure 7
Figure 7
Plots of FG+ cells retrogradely labeled from the nPGi (black: ipsilateral to injection site; gray: solely contralateral to injection site), and FG+ cells also containing Fos (green) of representative male (left sides) and female (right side) rat in all sections examined.
Figure 8
Figure 8
Mean proportion (± SEM) of FG+ cells retrogradely labeled from the nPGi that also contain sex-induced Fos for four rostrocaudal levels of the MPO. Numbers below atlas images are millimeters relative to Bregma. Note that females have a higher proportion of Fos/FG+ cells in rostral MPO levels, and that males have a higher proportion of Fos/FG+ cells in caudal MPO levels. * = significant male/female difference, p≤0.05.
Figure 9
Figure 9
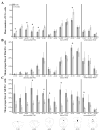
Mean proportion (± SEM) of FG+ cells that also contain sex-induced Fos in all regions with dense input to the nPGi. Note the regional specificity in sex differences in the proportion of Fos/FG+, and that only a few regions show high sex-induced Fos in projections to the nPGi. No differences reached significance at the α ≤ 0.0031 level.
Figure 10
Figure 10
Photomicrograph of a representative section of the perifornical nucleus (PeF) of the hypothalamus in a male (A and C) and female (B and D) rat. C and D are higher magnifications of the area indicated by the box. Neurons stained brown contain FG retrogradely labeled from the nPGi, nuclei stained black contain sex-induced Fos, and neurons stained brown with nuclei stained black are retrogradely labeled FG cells that also contain sex-induced Fos. Note that females have a higher proportion of FG labeled cells that also contain sex-induced Fos.
Figure 11
Figure 11
Photomicrograph of a representative section of the PVN in a male (A and C) and female (B and D) rat. C and D are higher magnifications of the area indicated by the box. Neurons stained brown contain FG retrogradely labeled from the nPGi, nuclei stained black contain sex-induced Fos, and neurons stained brown with nuclei stained black contain both FG and Fos. Note that both males and females have a similar high density of retrogradely labeled cells, and that many of these cells contain sex-induced Fos.
Figure 12
Figure 12
Mean proportion (± SEM) of FG+ cells retrogradely labeled from the nPGi that also contain sex-induced Fos for six rostrocaudal levels of the PAG. Numbers below atlas images are millimeters relative to Bregma. Male, dark gray; female, light gray. Note that in both sexes the proportion of Fos/FG+ cells is quite low. No differences reached significance at the α ≤ 0.05 level.
Figure 13
Figure 13
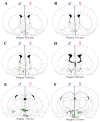
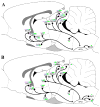
Summary diagram of regions that provide dense input to the nPGi in male (A) and female (B) rats. The color and length of bars adjacent to labels represent the relative density of FG labeled cells that also contain ERα (pink), AR (blue), or sex-induced Fos (green) in those regions.

Similar articles

Cited by

References

    1. Balthazart J, Absil P, Gerard M, Appeltants D, Ball GF. Appetitive and consummatory male sexual behavior in Japanese quail are differentially regulated by subregions of the preoptic medial nucleus. J Neurosci. 1998;18(16):6512–6527. - PMC - PubMed
    1. Balthazart J, Ball GF. Topography in the preoptic region: Differential regulation of appetitive and consummatory male sexual behaviors. Front Neuroendocrinol 2007 - PMC - PubMed
    1. Brozoski TJ, Ciobanu L, Bauer CA. Central neural activity in rats with tinnitus evaluated with manganese-enhanced magnetic resonance imaging (MEMRI) Hearing research. 2007;228(1–2):168–179. - PubMed
    1. Cameron A, Tomlin M. The effect of male erectile dysfunction on the psychosocial, relationship, and sexual characteristics of heterosexual women in the United States. J Sex Marital Ther. 2007;33(2):135–149. - PubMed
    1. Canteras NS, Goto M. Connections of the precommissural nucleus. J Comp Neurol. 1999;408(1):23–45. - PubMed

Publication types

Substances