. 2008 May;47(5):1667-79.
doi: 10.1002/hep.22225.

Beta-catenin deletion in hepatoblasts disrupts hepatic morphogenesis and survival during mouse development

Affiliations

Beta-catenin deletion in hepatoblasts disrupts hepatic morphogenesis and survival during mouse development

Xinping Tan et al. Hepatology. 2008 May.

Abstract

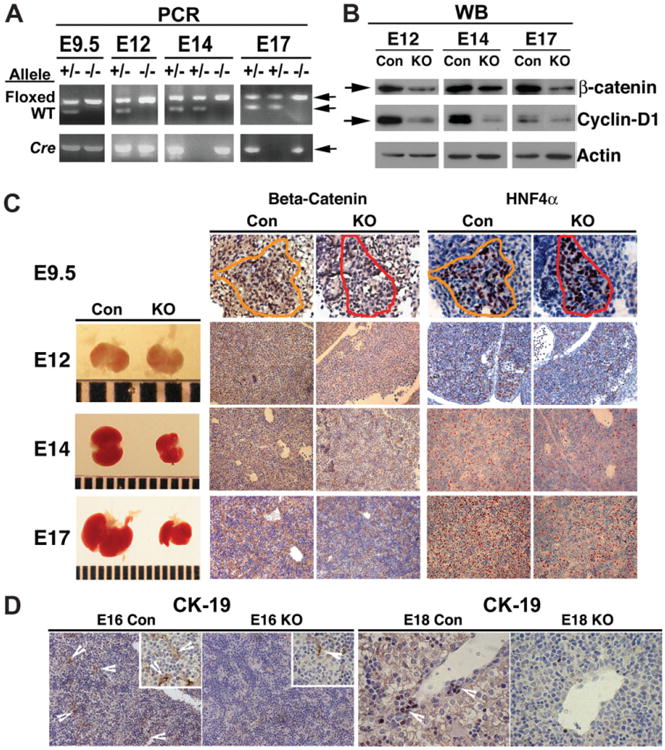
Beta-catenin, the central component of the canonical Wnt pathway, plays important roles in the processes of liver regeneration, growth, and cancer. Previously, we identified temporal expression of beta-catenin during liver development. Here, we characterize the hepatic phenotype, resulting from the successful deletion of beta-catenin in the developing hepatoblasts utilizing Foxa3-cyclization recombination and floxed-beta-catenin (exons 2 through 6) transgenic mice. Beta-catenin loss in developing livers resulted in significantly underdeveloped livers after embryonic day 12 (E12) with lethality occurring at around E17 stages. Histology revealed an overall deficient hepatocyte compartment due to (1) increased cell death due to oxidative stress and apoptosis, and (2) diminished expansion secondary to decreased cyclin-D1 and impaired proliferation. Also, the remnant hepatocytes demonstrated an immature phenotype as indicated by high nuclear to cytoplasmic ratio, poor cell polarity, absent glycogen, and decreased expression of key liver-enriched transcription factors: CCAAT-enhancer binding protein-alpha and hepatocyte nuclear factor-4alpha. A paucity of primitive bile ducts was also observed. While the stem cell assays demonstrated no intrinsic defect in hematopoiesis, distorted hepatic architecture and deficient hepatocyte compartments resulted in defective endothelial cell organization leading to overall fetal pallor.

Conclusion: Beta-catenin regulates multiple, critical events during the process of hepatic morphogenesis, including hepatoblast maturation, expansion, and survival, making it indispensable to survival.


Conflict of interest statement

Potential conflict of interest: Nothing to report.

Figures

Fig. 1
Fig. 1
β-Catenin deletion in Hep-Ctnnb1−/− livers with resulting effect on hepatocyte and biliary epithelial cells. (A) PCR analysis of the genomic DNA identifies β-catenin-null (knockout [KO]) or the Hep-Ctnnb1−/− embryos at E9.5 to E17 by the concomitant presence of floxed alleles and Cre-recombinase transgene, whereas the littermate controls (Con) show floxed and wild-type alleles with or without Cre-recombinase transgenes. (B) Western blot (WB) analysis using whole cell lysate of the developing livers at E12 to E17 identified a dramatic decrease in total β-catenin protein along its target, cyclin-D1 in the KO. Successful deletion of β-catenin in KO livers was also verified by IHC for β-catenin at E9.5 (×600) and E12 to E17 (×200). A dramatic decrease in overall liver size was detectable after E12. No difference in HN4α-positive hepatoblasts was apparent at E9.5 (×600) in the KO, however a dramatic difference was observed at E12 to E17 (×200) as compared to the respective controls.(D) E16 control livers show several CK-19-positive primitive bile ducts with a remarkable decrease in KO (×200). Higher magnification (600×) in the inset also shows CK-19-positive cells in KO and Con. A similar decrease in CK-19-positive cells in primitive portal triads are observed in E18 KO livers as compared to the controls (×600).
Fig. 2
Fig. 2
Decreased proliferation and survival of hepatocytes is evident in the Hep-Ctnnb1−/− livers. (A) Hematoxylin and eosin (H&E) staining of the developing livers reveal several hepatoblasts and hepatocytes (arrowheads) in the control livers at E12 to E17, with decreasing numbers of hematopoietic cells (arrows) with progressing fetal age. Knockout (KO) livers reveal a lower number of hepatoblasts and hepatocytes than controls at all ages after E12, with continued presence of hematopoietic cells even at E17. Several PCNA-positive cells are observed in E12 to E17 control livers with a dramatic decrease in the respective KO livers. A few TUNEL-positive apoptotic nuclei are observed in E12 Con and KO livers, whereas increased apoptotic nuclei were observed in E14 and E17 KO livers as compared to their controls (×400). (B) A 3-fold to 6-fold decrease in the numbers of PCNA-positive cells was identified in β-catenin KO livers at various stages of liver development, which was significant (P < 0.05). (C) A 3-fold to 4-fold increase in apoptosis was observed at stages E14 and E17 in β-catenin KO livers, which was significant (P < 0.05).
Fig. 3
Fig. 3
Hep-Ctnnb1−/− livers reveal aberrant ultrastructure and elevated oxidative stress. (A) Electron microscopy (EM) of control E15 and E17 livers shows normal hepatocytes (1) containing normal nuclei (n), endoplasmic reticulum cells (e), and mitochondria (m), normal erythroblasts (2), and normal endothelial cells (3). EM of the Hep-Ctnnb1−/− livers at E15 and E17 shows normal blood cells (2), no endothelial cells, and the hepatocytes (1) that display blebbing (bl) and loss of ultrastructural integrity. (B) IHC for 4-HNE reveals smaller hematopoietic cells staining-positive (arrowhead, upper panel) at E17 in control livers, whereas many larger hepatocytes were 4-HNE-positive (arrowhead, lower panel) in the knockout (KO). (×400) (C) Around 2-fold higher MDA and 4-HNE adducts were identified in the Hep-Ctnnb1−/− livers (n = 4) as compared to age-matched controls (n = 4). Also, the baseline lipid peroxidation was around 30% higher in pooled E17 control livers as compared to normal adult livers. (D) Normalized gene array (to the expression of hepatocyte genes-albumin and α-fetoprotein) at E16.5 shows several-fold lower expression of variousGSTs in the Hep-Ctnnb1−/− livers as compared to littermate controls. (E) The decrease in key GSTs in KO was validated by RT-PCR.
Fig. 4
Fig. 4
Inadequate maturation of remnant hepatocytes in β-catenin null livers during development is attributable to loss of C/EBPα. (A) Hematoxylin and eosin (H&E) staining (×600) of the E17 control liver (Con) shows predominantly mature hepatocytes with polarity and clear cytoplasm (bold arrow) and a few hematopoietic cells (arrow), whereas the β-catenin-deficient livers (knockout [KO]) show predominant hematopoietic cells (arrow) with a few immature hepatocytes that have high nuclear to cytoplasmic ratio and lack polarity (bold arrow). Periodic acid-Schiff (PAS) staining (×400) shows E17 control livers with extensive glycogen in hepatocytes and E17 KO hepatocytes devoid of glycogen. IF for ZO-1 (×400) shows several tight junctions in the E17 control livers, whereas the KO livers show a dramatic decrease in the numbers of tight junctions. (B) Western blot using the total cell lysates of the E-cadherin-sorted fractions of E17 Con and KO livers show a dramatic decrease in C/EBPα levels in KO. Ponceau Red verifies equal loading in the lower panel. (C) E17 control livers show E-cadherin-positive cells (green) with nuclear C/EBPα (red) as identified by white arrowheads. The KO livers show a few E-cadherin-positive cells (green) that lack nuclear C/EBPα (red) as identified by white arrows (×400). Nuclei were counterstained with Hoesch stain. Smaller panels show E-cadherin (green) and C/EBPα (red) IF without counterstain clearly identifying lack of C/EBPα in β-catenin deficient livers in E-cadherin-positive cells.
Fig. 5
Fig. 5
Changes in AJs in absence of β-catenin during liver development. (A) Decreased total protein levels of E-cadherin are observed in Hep-Ctnnb1−/− livers at E14 to E16, whereas decrease in p120 and plakoglobin or γ-catenin was observed after the E15 stage in the Hep-Ctnnb1−/− livers, in a representative western blot (WB). Actin confirms equal loading. (B) A relative increase in association of p120 and γ-catenin to E-cadherin at E14 and of γ-catenin and E-cadherin at E15 to E16 stages in the Hep-Ctnnb1−/− livers by coprecipitation. This increase is more pronounced when the low levels of total E-cadherin and γ-catenin levels in the Hep-Ctnnb1−/− livers at these stages is taken into account.
Fig. 6
Fig. 6
Normal intrinsic hematopoiesis in β-catenin-deficient livers. (A) Fluorescence-activated cell sorting (FACS) analysis shows comparable numbers of C-kit-positive and Ter-119-positive cells in the Con and knockout (KO) livers at E16 stage. Respective isotype controls are included in the left panel. (B) CFC-assay identified equivalent numbers of colonies using 5 × 10⁵ cells from E16 Hep-Ctnnb1−/− or control livers. The different types of colonies are labeled s follows: Mix, colony-forming unit granulocyte-erythrocyte-megakaryocyte-monocyte (CFU-GEMM) multipotential; GM, CFU granulocyte-monocyte; M, CFU monocyte; G, CFU granulocyte; E, burst-forming unit erythroid (BFU-E); Endo, endothelial.
Fig. 7
Fig. 7
Disrupted endothelial cell organization in the Hep-Ctnnb1−/− livers. (A) Isolectin B4-positive endothelial cells (arrowheads) line primitive sinusoidal space in E17 control livers, whereas several sinusoidal spaces (*) showed discontinuous isolectin-B4-positive cells in the knockout (KO) livers shown in two representative right panels. (B) Platelet endothelial cell adhesion molecule (PECAM) IHC also identified endothelial cells in control (WT) and KO livers, with a haphazard arrangement of endothelial cells in the latter (arrowhead). (C) Several hepatocytes in the E16 control livers are VEGF-positive (red), whereas only a few VEGF-expressing cells were observed in the E16 Hep-Ct-nnb1−/− livers.

References

    1. Haegel H, Larue L, Ohsugi M, Fedorov L, Herrenknecht K, Kemler R. Lack of beta-catenin affects mouse development at gastrulation. Development. 1995;121:3529–3537. - PubMed
    1. Peifer M, Polakis P. Wnt signaling in oncogenesis and embryogenesis—a look outside the nucleus. Science. 2000;287:1606–1609. - PubMed
    1. Morin PJ. beta-Catenin signaling and cancer. Bioessays. 1999;21:1021–1030. - PubMed
    1. Pennisi E. How a growth control path takes a wrong turn to cancer. Science. 1998;281:1438–1439. News; Comment. erratum appears in Science 1998;281:1809. - PubMed
    1. Barker N, Morin PJ, Clevers H. The Yin-Yang of TCF/beta-catenin signaling. Adv Cancer Res. 2000;77:1–24. - PubMed

Publication types